Fig. 3.
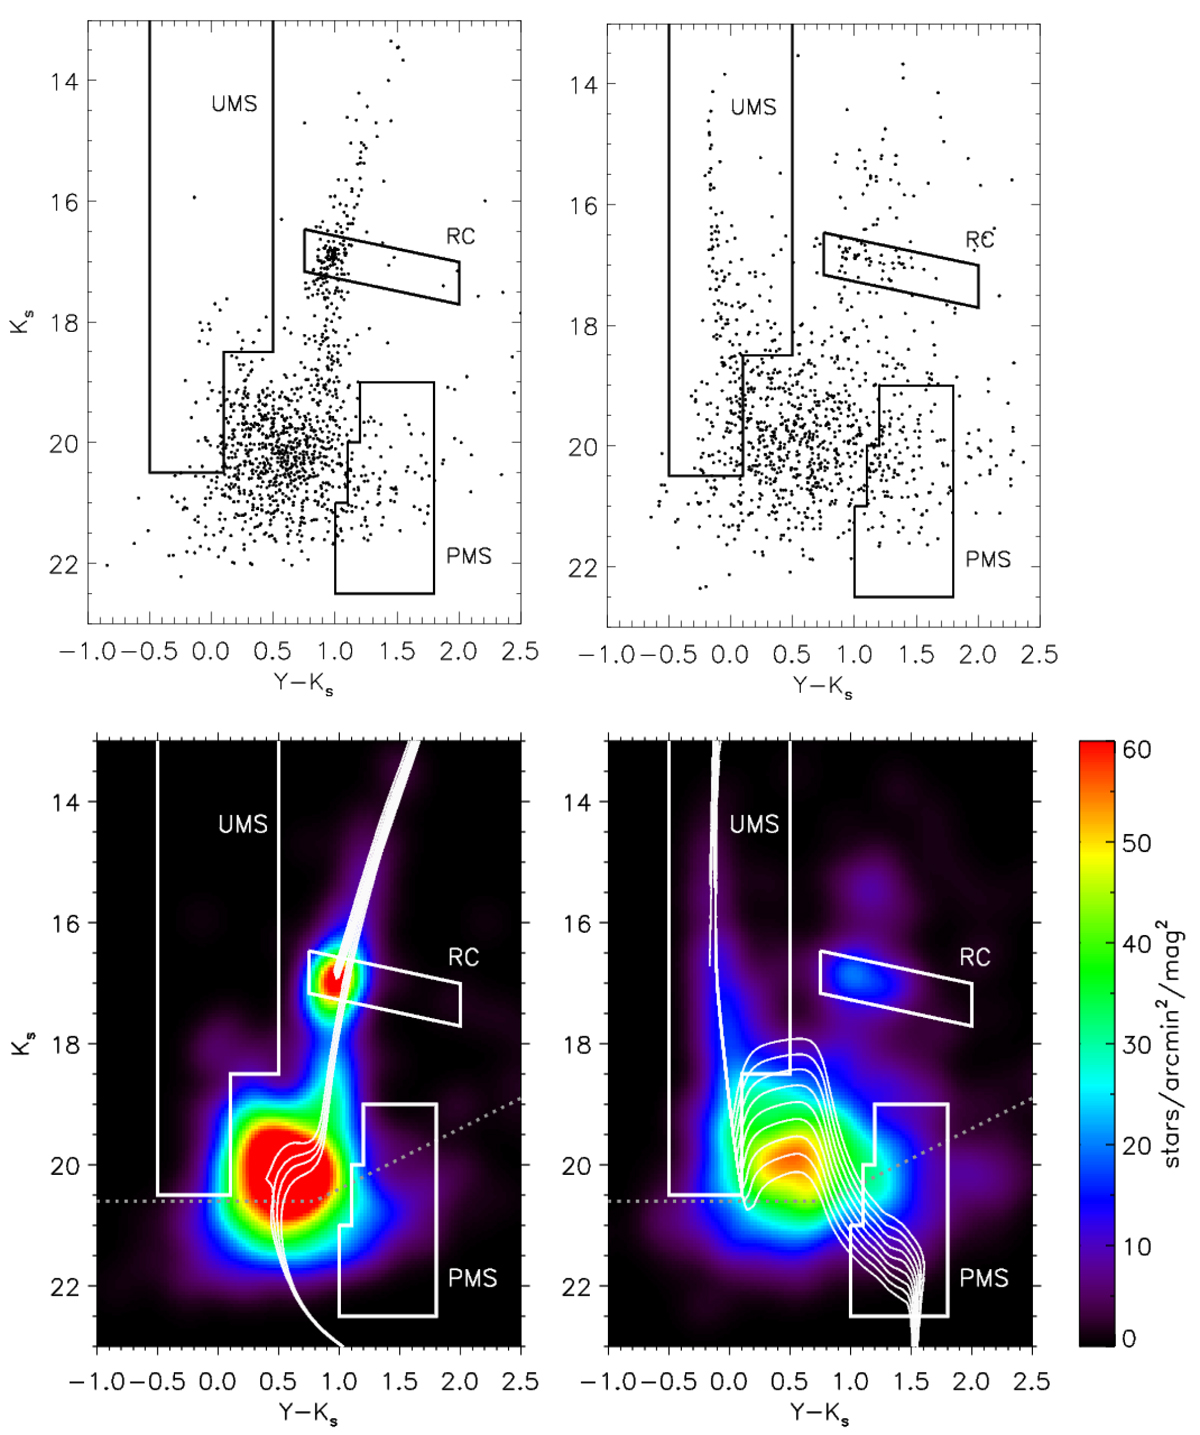
Top: CMDs of two example grid elements. Boxes indicate the UMS and PMS regions used in the control field selection, as well as the RC region used to determine the mean extinction (see Sect. 3.2 for details). The slope of the RC selection box is defined by the reddening vector. Bottom: corresponding Hess CMDs. Thin solid lines are PARSEC isochrones (Bressan et al. 2012) for log(t/yr) ∈ [9.5, 9.6, 9.7, 9.8] and Z = 0.0033 (left panel), and log(t/yr) ∈ [6.0, 6.1, 6.2, 6.3, 6.4, 6.5, 6.6, 6.7, 6.8] and Z = 0.008 (right panel). The assumed metallicities are typical for the age ranges (Rubele et al. 2012; Tatton et al. 2013). The isochrones are shifted by a distance modulus of 18.49 mag (de Grijs et al. 2014), and an extinction correction derived from the RC analysis (see text) is applied. The dotted line marks the typical 50% completeness level.
Current usage metrics show cumulative count of Article Views (full-text article views including HTML views, PDF and ePub downloads, according to the available data) and Abstracts Views on Vision4Press platform.
Data correspond to usage on the plateform after 2015. The current usage metrics is available 48-96 hours after online publication and is updated daily on week days.
Initial download of the metrics may take a while.