Fig. 2.
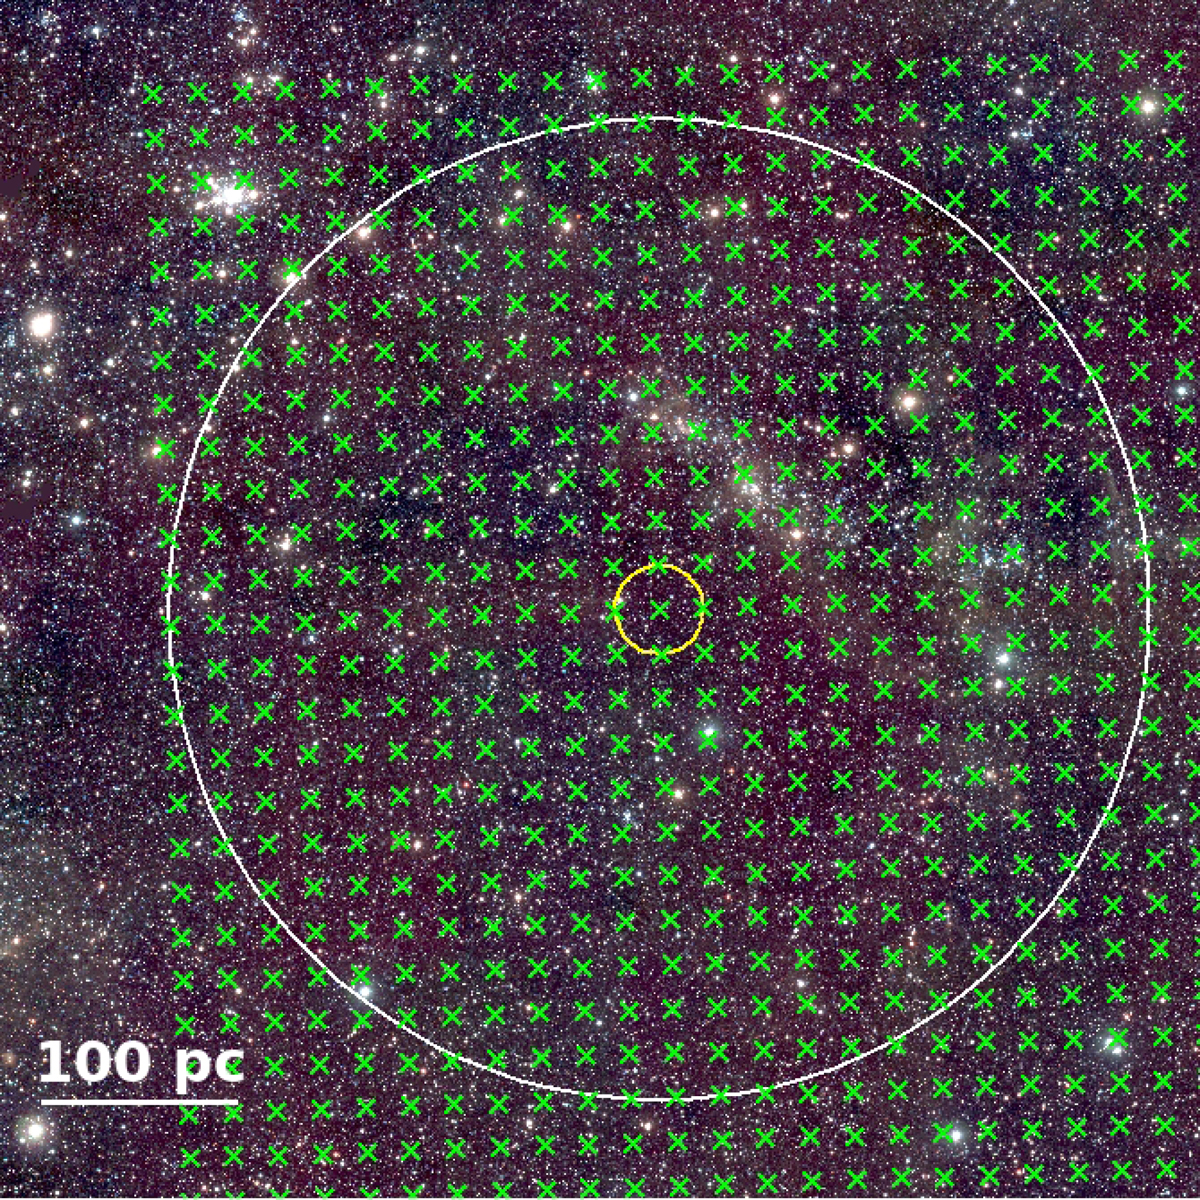
VISTA RGB composite with Y (1.02 μm) in blue, J (1.25 μm) in green, and Ks (2.15 μm) in red showing the north-eastern corner of the pilot field. Green crosses are placed at the centres of the grid elements (90″ radius in this instance). The small yellow circle highlights an example grid element, while the large white circle shows the area searched to identify suitable control field regions (see text).
Current usage metrics show cumulative count of Article Views (full-text article views including HTML views, PDF and ePub downloads, according to the available data) and Abstracts Views on Vision4Press platform.
Data correspond to usage on the plateform after 2015. The current usage metrics is available 48-96 hours after online publication and is updated daily on week days.
Initial download of the metrics may take a while.