Fig. A.1.
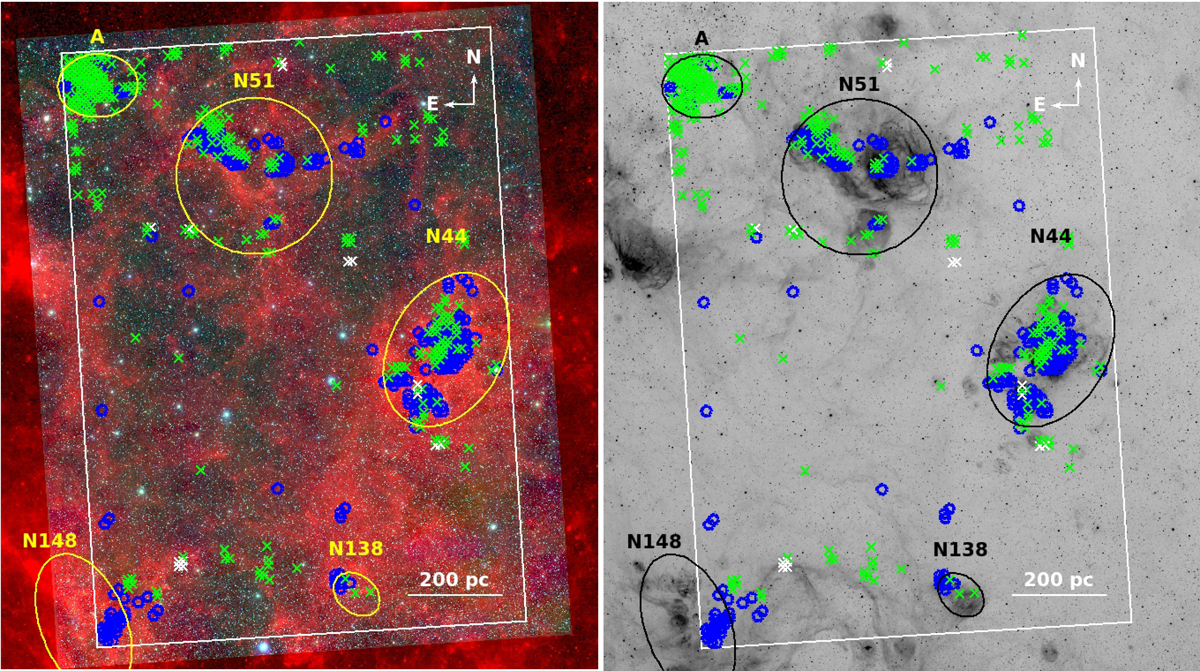
Left: three-colour composite image with VMC Y (blue) and Ks bands (green), and Spitzer IRAC 8.0 μm (see also Fig. 9). Green and white crosses mark the locations of elements classified as UMS and “old”, respectively. The UMS+PMS and PMS-only classified elements are included as blue circles to facilitate comparison. Right: same as the left panel, but using an inverted grey-scale image of the Hα emission.
Current usage metrics show cumulative count of Article Views (full-text article views including HTML views, PDF and ePub downloads, according to the available data) and Abstracts Views on Vision4Press platform.
Data correspond to usage on the plateform after 2015. The current usage metrics is available 48-96 hours after online publication and is updated daily on week days.
Initial download of the metrics may take a while.