Fig. 12.
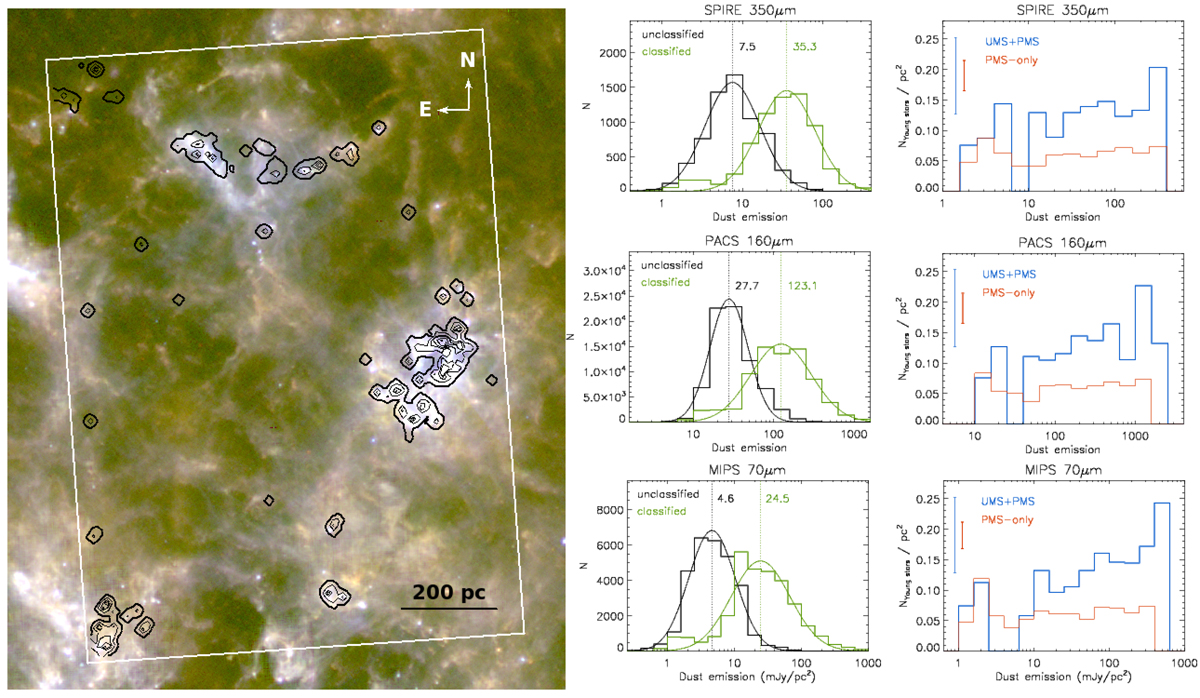
Left panel: three-colour composite image with Spitzer MIPS 70 μm in blue, Herschel PACS 160 μm in green, and Herschel SPIRE 350 μm in red; the density contours are the same as those in Fig. 9. Middle panels: dust emission distribution for image pixels in areas covered by the UMS+PMS and PMS-only classified elements, and by the same number of randomly selected unclassified elements. A Gaussian fit is plotted and the mean of the fit is indicated. Right panels: dust emission vs. young stars number density for the PMS and UMS+PMS classified elements. The error bars show the typical standard deviations within the dust emission bins.
Current usage metrics show cumulative count of Article Views (full-text article views including HTML views, PDF and ePub downloads, according to the available data) and Abstracts Views on Vision4Press platform.
Data correspond to usage on the plateform after 2015. The current usage metrics is available 48-96 hours after online publication and is updated daily on week days.
Initial download of the metrics may take a while.