Free Access
Fig. 11.
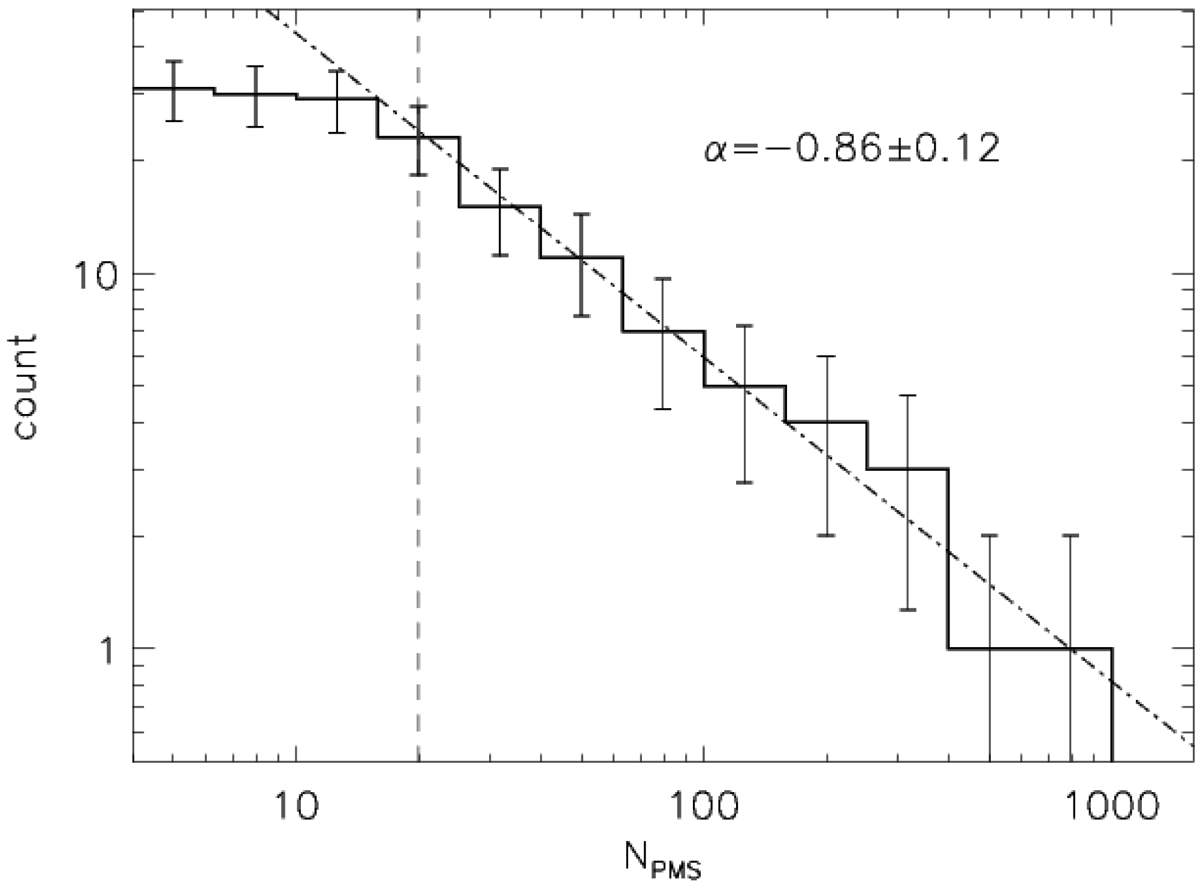
Cumulative number distribution for the 31 PMS structures (0.2 dex bins). The vertical dashed line indicates the sensitivity limit, while the dash-dotted line represents a power law with a slope of −0.86. The error bars represent the Poissonian uncertainties.
Current usage metrics show cumulative count of Article Views (full-text article views including HTML views, PDF and ePub downloads, according to the available data) and Abstracts Views on Vision4Press platform.
Data correspond to usage on the plateform after 2015. The current usage metrics is available 48-96 hours after online publication and is updated daily on week days.
Initial download of the metrics may take a while.