Fig. 9.
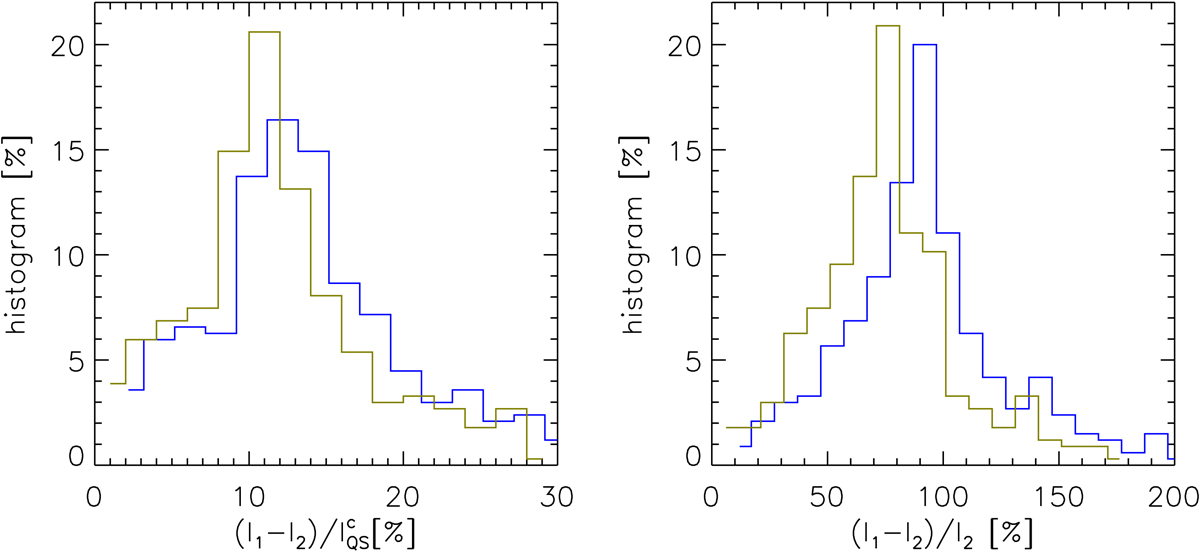
Histograms of the measured intensity increase between the flare and post-WLF states (blue, equivalent to the difference of continuum intensity of the red and blue profiles in Fig. 6) and the determined chromospheric continuum contribution to this increase (olive, equivalent to the difference of continuum intensity of the red and olive profiles in Fig. 6), both assessed in the region of interest shown by the blue contour in Fig. 1. Left panel: values normalised by the continuum intensity of the quiet Sun ![]() , Right panel: values normalised by the local continuum intensity in the post-WLF state I2.
, Right panel: values normalised by the local continuum intensity in the post-WLF state I2.
Current usage metrics show cumulative count of Article Views (full-text article views including HTML views, PDF and ePub downloads, according to the available data) and Abstracts Views on Vision4Press platform.
Data correspond to usage on the plateform after 2015. The current usage metrics is available 48-96 hours after online publication and is updated daily on week days.
Initial download of the metrics may take a while.