Fig. 7.
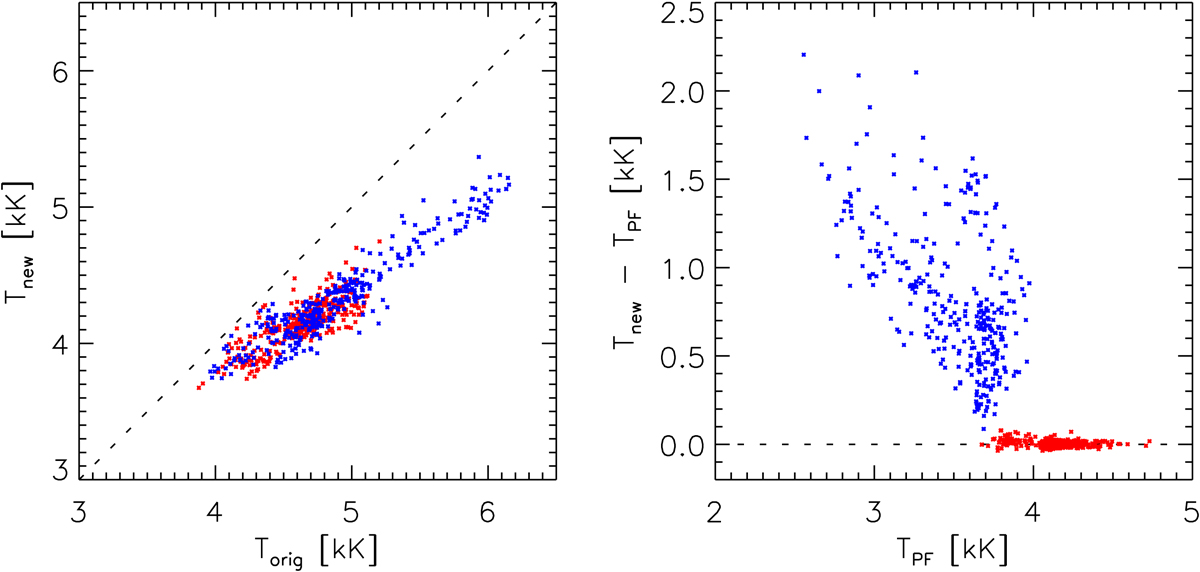
Left panel: scatter plot showing the relation between the temperature resulting from the original inversion (Torig) and temperature resulting from the Stokes I profile reduced by a flat continuum (Tnew). Right panel: scatter plot showing the temperature change between Tnew and the temperature obtained from the post-WLF phase TPF. Red and blue symbols correspond to log τ = 0 and −2, respectively.
Current usage metrics show cumulative count of Article Views (full-text article views including HTML views, PDF and ePub downloads, according to the available data) and Abstracts Views on Vision4Press platform.
Data correspond to usage on the plateform after 2015. The current usage metrics is available 48-96 hours after online publication and is updated daily on week days.
Initial download of the metrics may take a while.