Fig. 6.
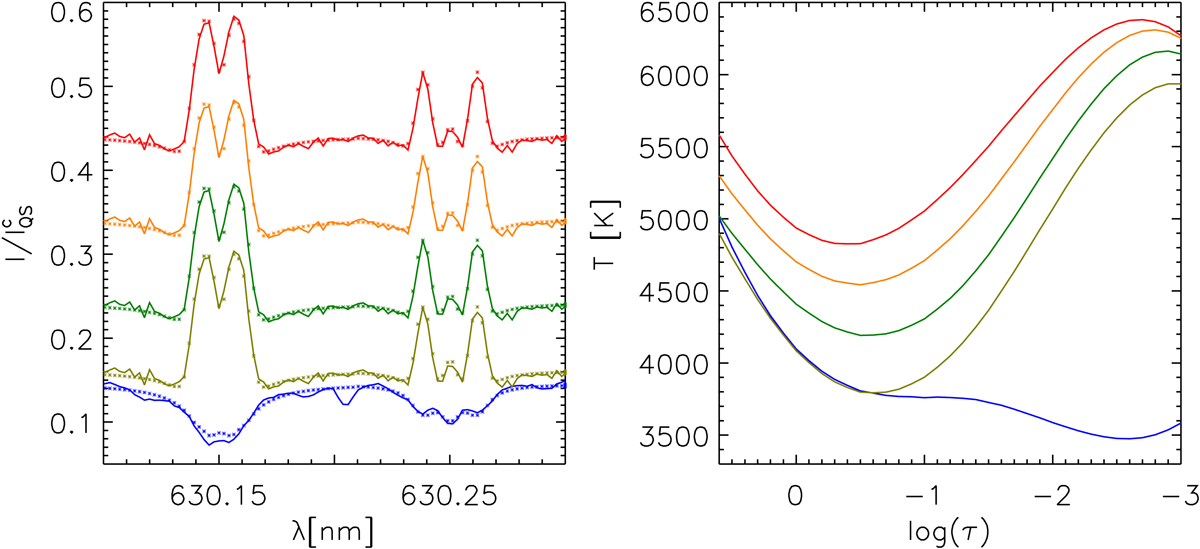
Comparison of the temperature stratifications resulting from the inversion of Stokes profiles, where the Stokes I profile was reduced by a flat continuum of ![]() (red),
(red), ![]() (orange),
(orange), ![]() (green), and
(green), and ![]() (olive). The blue Stokes I profile corresponds to the post-WLF phase at the same location and the temperature stratification indicated by the blue line corresponds to this profile. Left panel: lines correspond to the observed profiles, and the * symbols to the best fits obtained by the inversion code SIR.
(olive). The blue Stokes I profile corresponds to the post-WLF phase at the same location and the temperature stratification indicated by the blue line corresponds to this profile. Left panel: lines correspond to the observed profiles, and the * symbols to the best fits obtained by the inversion code SIR.
Current usage metrics show cumulative count of Article Views (full-text article views including HTML views, PDF and ePub downloads, according to the available data) and Abstracts Views on Vision4Press platform.
Data correspond to usage on the plateform after 2015. The current usage metrics is available 48-96 hours after online publication and is updated daily on week days.
Initial download of the metrics may take a while.