Fig. 4.
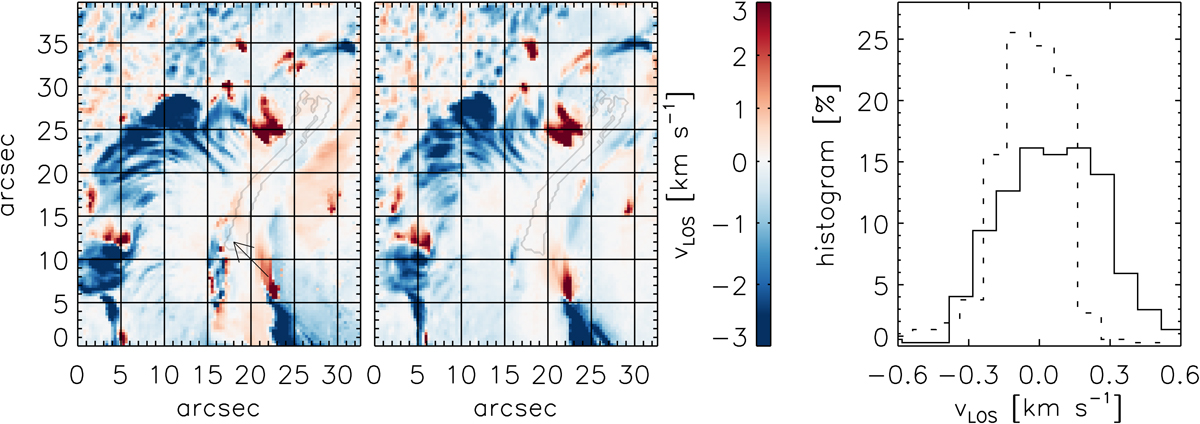
LOS velocity maps for the WLF phase (left map) and the post-WLF phase (right map). Positive values (redshifts) correspond to downflows. The histograms on the right show the distribution of υLOS in the analysed region where the solid and dashed lines correspond to the WLF and post-WLF phases, respectively. The arrow points to the pixel, where we observed the Stokes profiles displayed in Figs. 3 and 6.
Current usage metrics show cumulative count of Article Views (full-text article views including HTML views, PDF and ePub downloads, according to the available data) and Abstracts Views on Vision4Press platform.
Data correspond to usage on the plateform after 2015. The current usage metrics is available 48-96 hours after online publication and is updated daily on week days.
Initial download of the metrics may take a while.