Fig. 3.
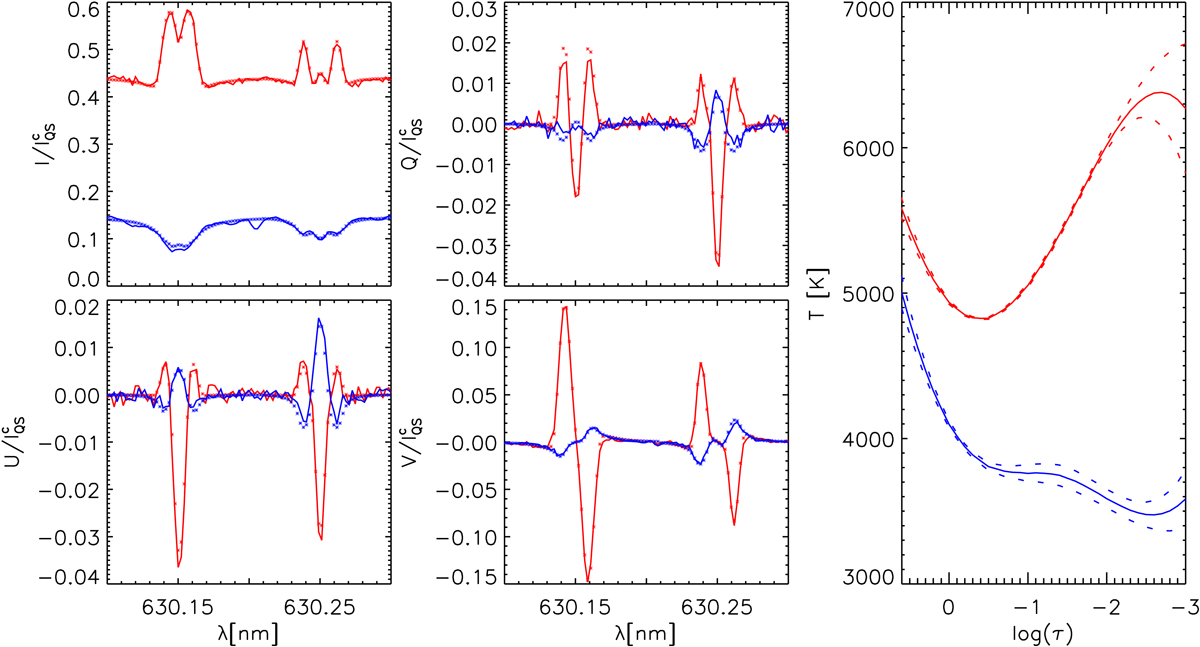
Four left panels: comparison of the Stokes profiles observed during the WLF (red lines) and in the post-WLF phase (blue lines); the * symbols in the respective colours indicate the best fit of these profiles achieved with the inversion code. Right panel: temperature stratifications obtained by the inversion code for the flare (red) and post-WLF (blue) phase; the dashed lines show the error margin determined by the inversion code SIR.
Current usage metrics show cumulative count of Article Views (full-text article views including HTML views, PDF and ePub downloads, according to the available data) and Abstracts Views on Vision4Press platform.
Data correspond to usage on the plateform after 2015. The current usage metrics is available 48-96 hours after online publication and is updated daily on week days.
Initial download of the metrics may take a while.