Free Access
Fig. 2.
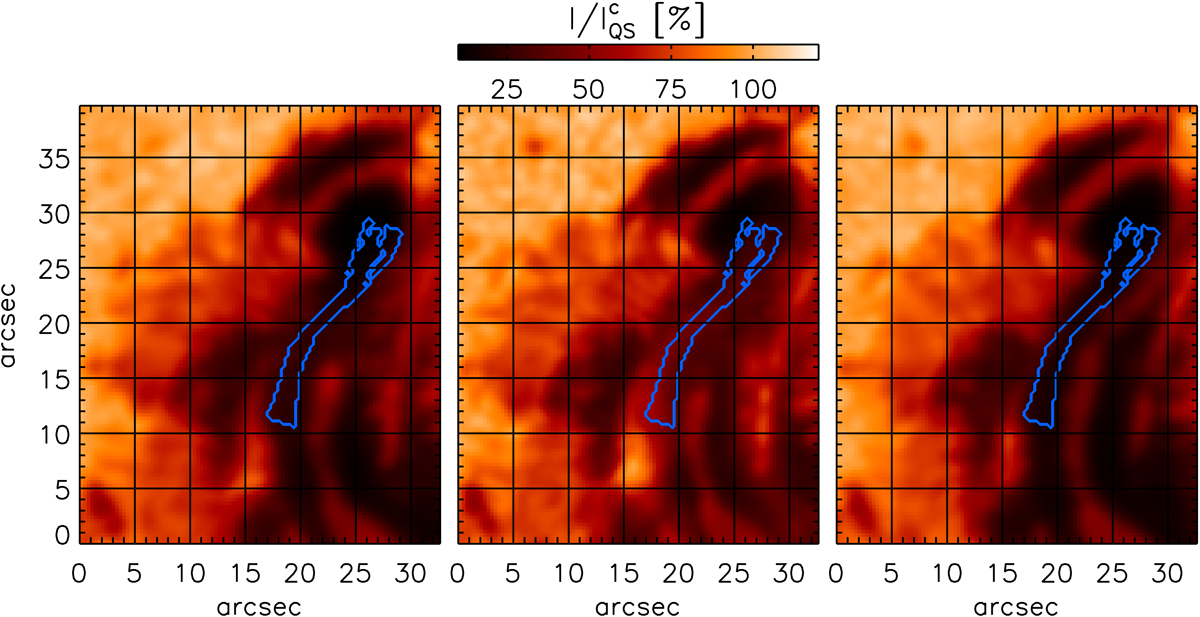
Pseudo-continuum intensity maps from HMI/SDO. We show the pre-flare phase at 11:31 UT (left map), flare phase at 12:01 UT (middle map), and post-WLF phase at 12:31 UT (right map). For display purposes, the HMI data were interpolated to the Hinode SP resolution.
Current usage metrics show cumulative count of Article Views (full-text article views including HTML views, PDF and ePub downloads, according to the available data) and Abstracts Views on Vision4Press platform.
Data correspond to usage on the plateform after 2015. The current usage metrics is available 48-96 hours after online publication and is updated daily on week days.
Initial download of the metrics may take a while.