Fig. 1.
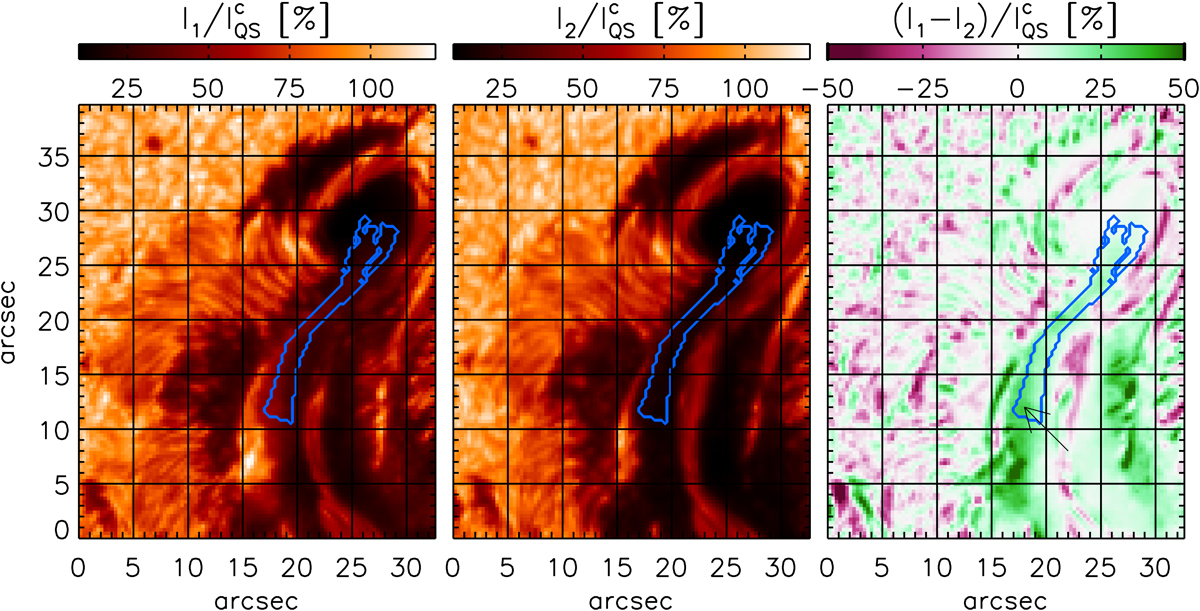
Continuum intensity maps reconstructed from the two Hinode raster scans. The left map was scanned between 11:57 UT and 12:04 UT and captured a WLF ribbon; the middle map was scanned between 12:19 UT and 12:42 UT. On the right map is the intensity difference between these two scans. The blue contour indicates the region where we ascribe the intensity difference to the WLF. The arrow points to a pixel where we observed the Stokes profiles displayed in Figs. 3 and 6. The labels I1 and I2 correspond to the continuum intensities observed during the first and second Hinode/SP scan, respectively.
Current usage metrics show cumulative count of Article Views (full-text article views including HTML views, PDF and ePub downloads, according to the available data) and Abstracts Views on Vision4Press platform.
Data correspond to usage on the plateform after 2015. The current usage metrics is available 48-96 hours after online publication and is updated daily on week days.
Initial download of the metrics may take a while.