Fig. 9.
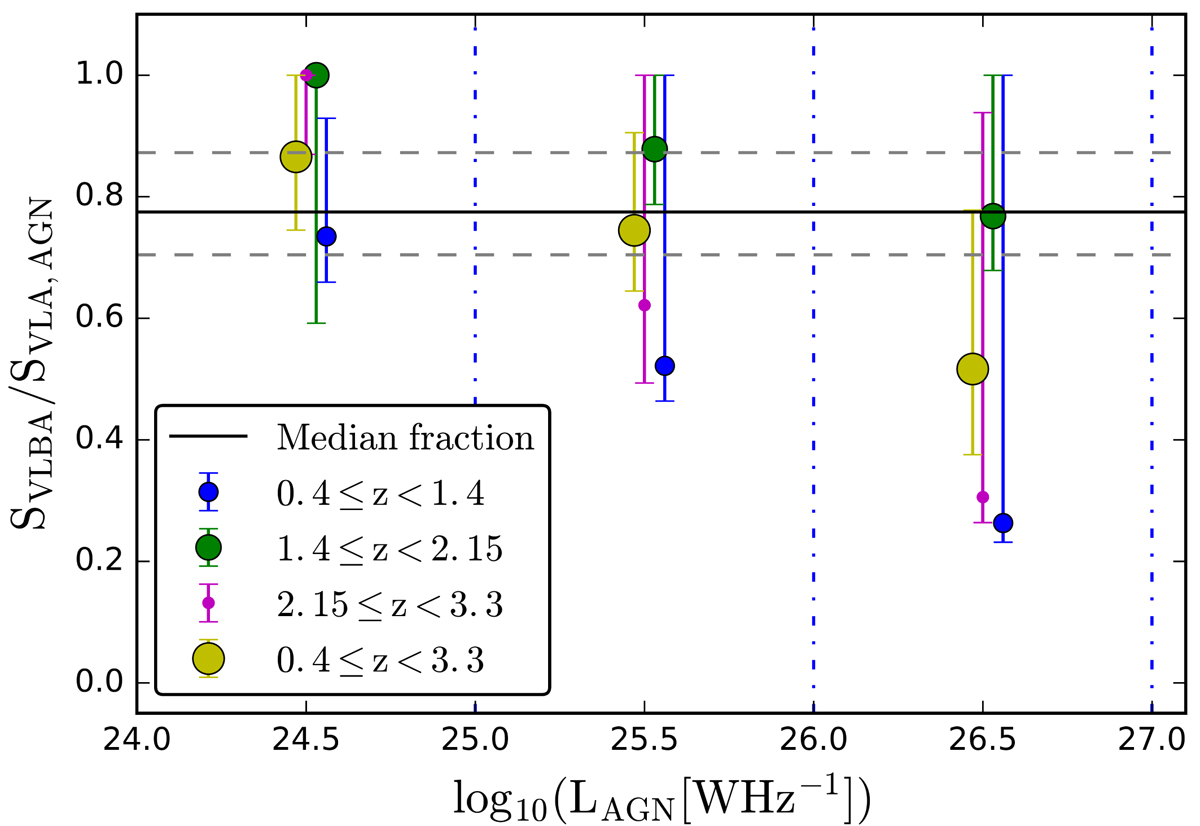
VLBA-to-VLA AGN flux density ratio vs. 1.4 GHz AGN luminosity. Yellow circles show the luminosity binned values of the ratio, while solid and dashed black lines show the median, 84th and 16th percentile values of the sample with L1.4 GHz, TOT ≥ 1024.4 WHz−1. Blue, green, and magenta circles and error bars show the data in three redshift bins as indicated in the legend. For better visibility of error bars, we introduced a small shift along the luminosity axis.
Current usage metrics show cumulative count of Article Views (full-text article views including HTML views, PDF and ePub downloads, according to the available data) and Abstracts Views on Vision4Press platform.
Data correspond to usage on the plateform after 2015. The current usage metrics is available 48-96 hours after online publication and is updated daily on week days.
Initial download of the metrics may take a while.