Fig. 8.
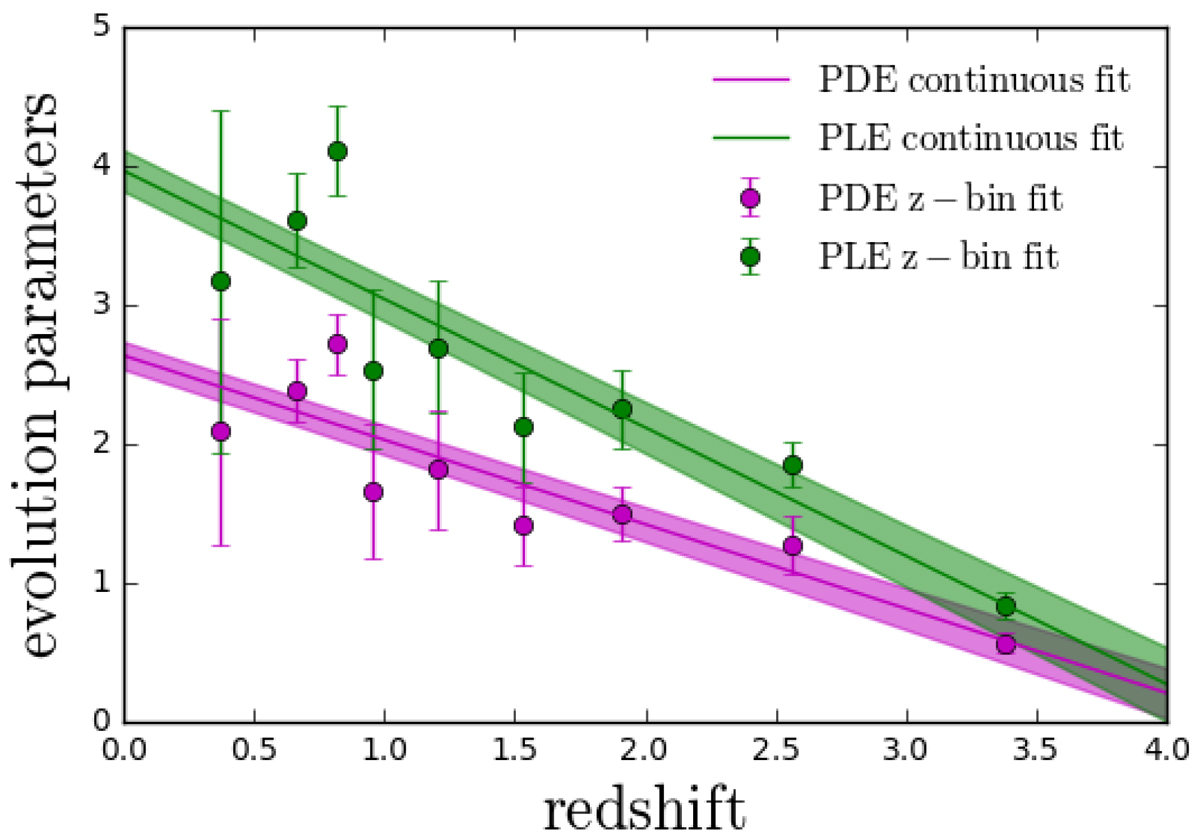
Parameters obtained from fitting two different redshift evolution models to the HLAGN luminosity functions. Green and magenta circles show the evolution parameters obtained from fitting the assumed analytic form of the luminosity function in nine redshift bins assuming pure luminosity and pure density evolution scenarios, respectively (see text for details). The same color lines show the results from the continuous fit assuming that the PLE and PDE parameters evolve linearly with redshift.
Current usage metrics show cumulative count of Article Views (full-text article views including HTML views, PDF and ePub downloads, according to the available data) and Abstracts Views on Vision4Press platform.
Data correspond to usage on the plateform after 2015. The current usage metrics is available 48-96 hours after online publication and is updated daily on week days.
Initial download of the metrics may take a while.