Fig. 7.
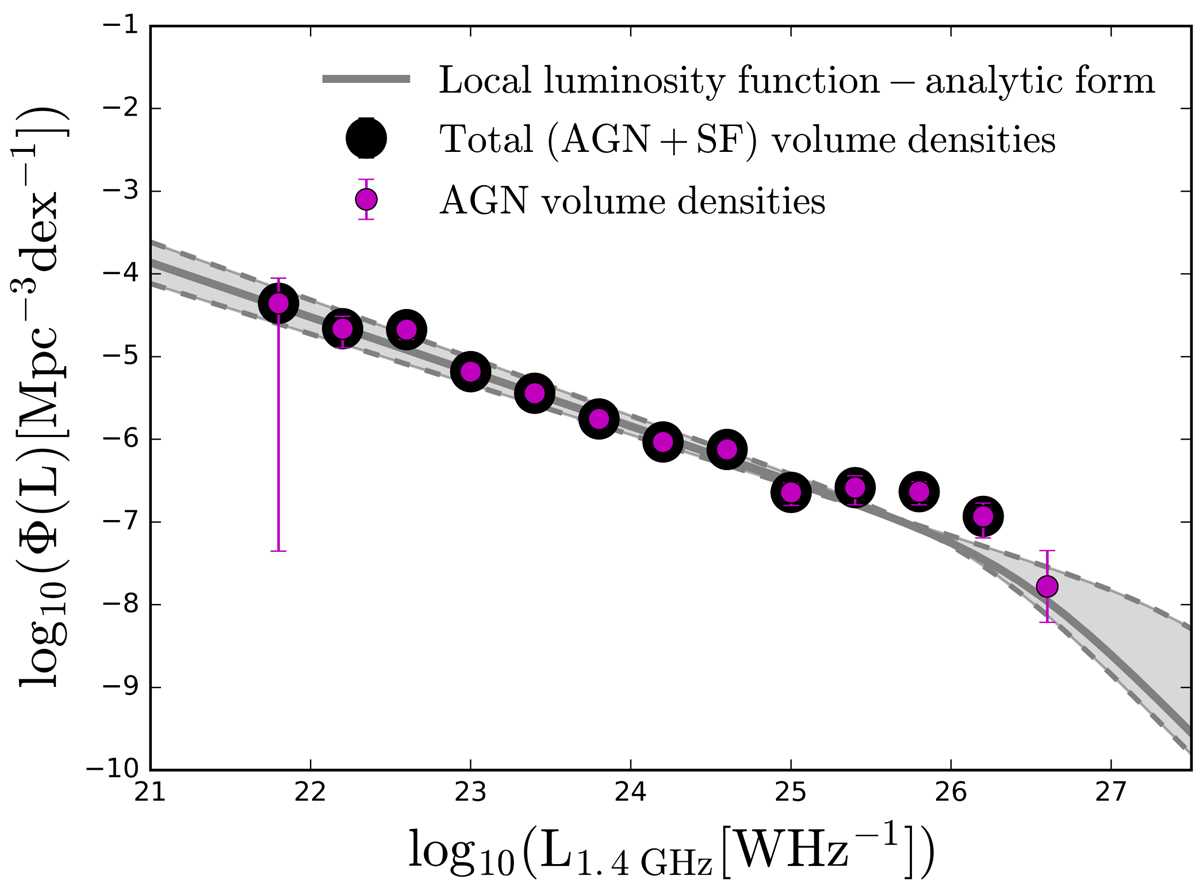
Local HERG luminosity function. Black circles show the total (AGN+SF) volume densities, while the gray line is the analytic fit to the data as done by Pracy et al. (2016). Magenta circles show the AGN luminosity functions derived by decomposing the total luminosity. The overlap between AGN and total volume densities confirms that the radio luminosity of sources in the HERG sample by Pracy et al. (2016) is dominated by the AGN emission.
Current usage metrics show cumulative count of Article Views (full-text article views including HTML views, PDF and ePub downloads, according to the available data) and Abstracts Views on Vision4Press platform.
Data correspond to usage on the plateform after 2015. The current usage metrics is available 48-96 hours after online publication and is updated daily on week days.
Initial download of the metrics may take a while.