Fig. 6.
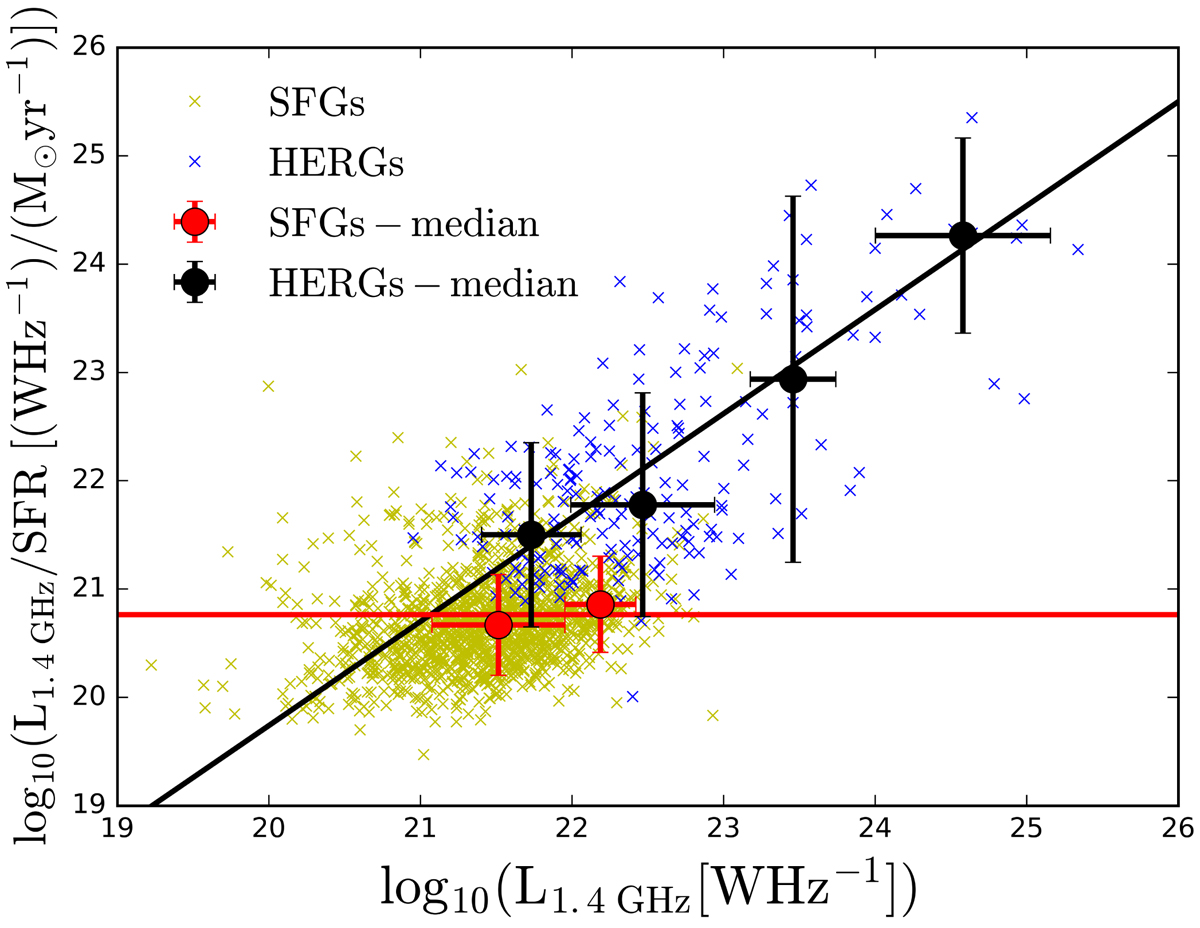
Distribution of the ratio of 1.4 GHz radio luminosity to SFR as a function of the 1.4 GHz radio luminosity for HERGs (blue symbols) and SFGs (yellow symbols) drawn from the LARGESS sample and cross-correlated with the MPA-JHU DR7 catalog. Median values of the ratio for HERGs and SFGs are shown by the filled black and red circles, respectively. The black solid line represents the linear fit to the median values for the HERG population. The red solid line represents the average value of the ratio of 1.4 GHz luminosity to SFR for star forming galaxies.
Current usage metrics show cumulative count of Article Views (full-text article views including HTML views, PDF and ePub downloads, according to the available data) and Abstracts Views on Vision4Press platform.
Data correspond to usage on the plateform after 2015. The current usage metrics is available 48-96 hours after online publication and is updated daily on week days.
Initial download of the metrics may take a while.