Fig. 3.
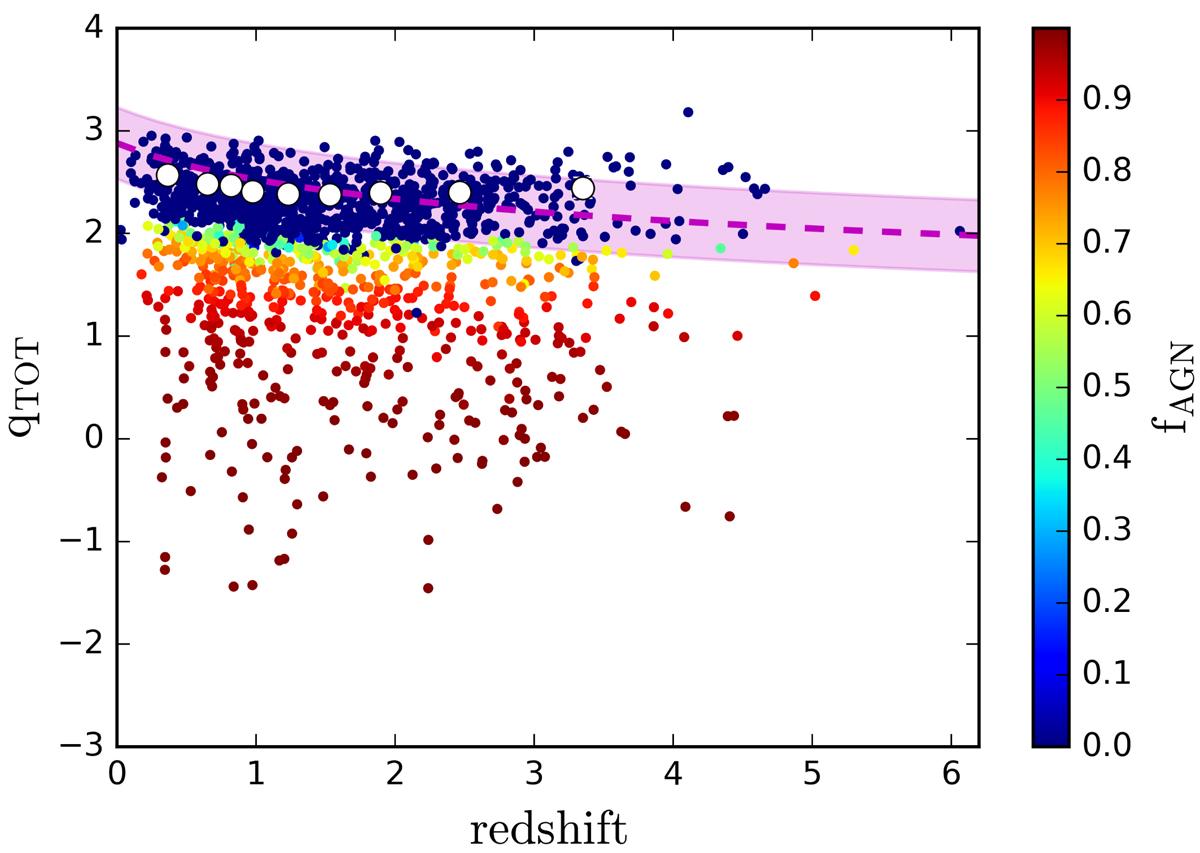
Infrared-to-1.4 GHz radio luminosity ratio (qTOT) vs. redshift for the HLAGN. The data are color-coded by their median values of AGN fractions. The magenta dashed line is the redshift dependent analytic form calibrated by Delhaize et al. (2017) on a sample of SFGs, with ±1σ spread (magenta area). White dots show the peaks (q̄SF,z) of the underlying qTOT distribution calibrated on the star-forming galaxies in the full radio detected sample.
Current usage metrics show cumulative count of Article Views (full-text article views including HTML views, PDF and ePub downloads, according to the available data) and Abstracts Views on Vision4Press platform.
Data correspond to usage on the plateform after 2015. The current usage metrics is available 48-96 hours after online publication and is updated daily on week days.
Initial download of the metrics may take a while.