Fig. 2.
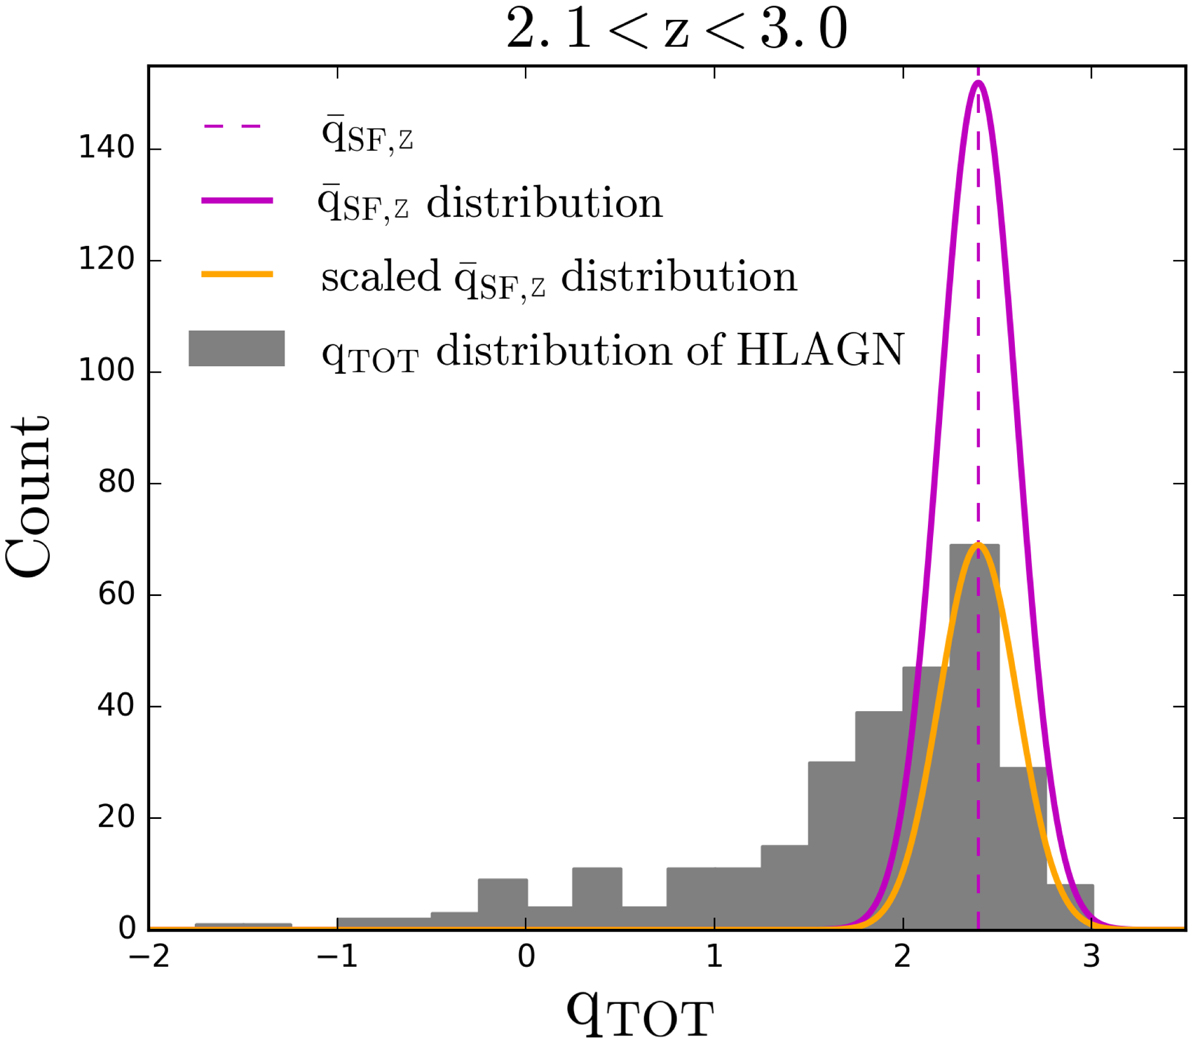
Example of one iteration of the qTOT distribution for the HLAGN (gray histogram) overlaid with the Gaussian functional forms showing the contribution of star-forming processes in the redshift bin 2.1 < z < 3.0. Gaussian functional forms show the contribution from the star formation as derived from the full sample and after scaling it to the normalization of the HLAGN distribution at the q̄SF,z (shown with magenta and orange lines, respectively).
Current usage metrics show cumulative count of Article Views (full-text article views including HTML views, PDF and ePub downloads, according to the available data) and Abstracts Views on Vision4Press platform.
Data correspond to usage on the plateform after 2015. The current usage metrics is available 48-96 hours after online publication and is updated daily on week days.
Initial download of the metrics may take a while.