Fig. A.2.
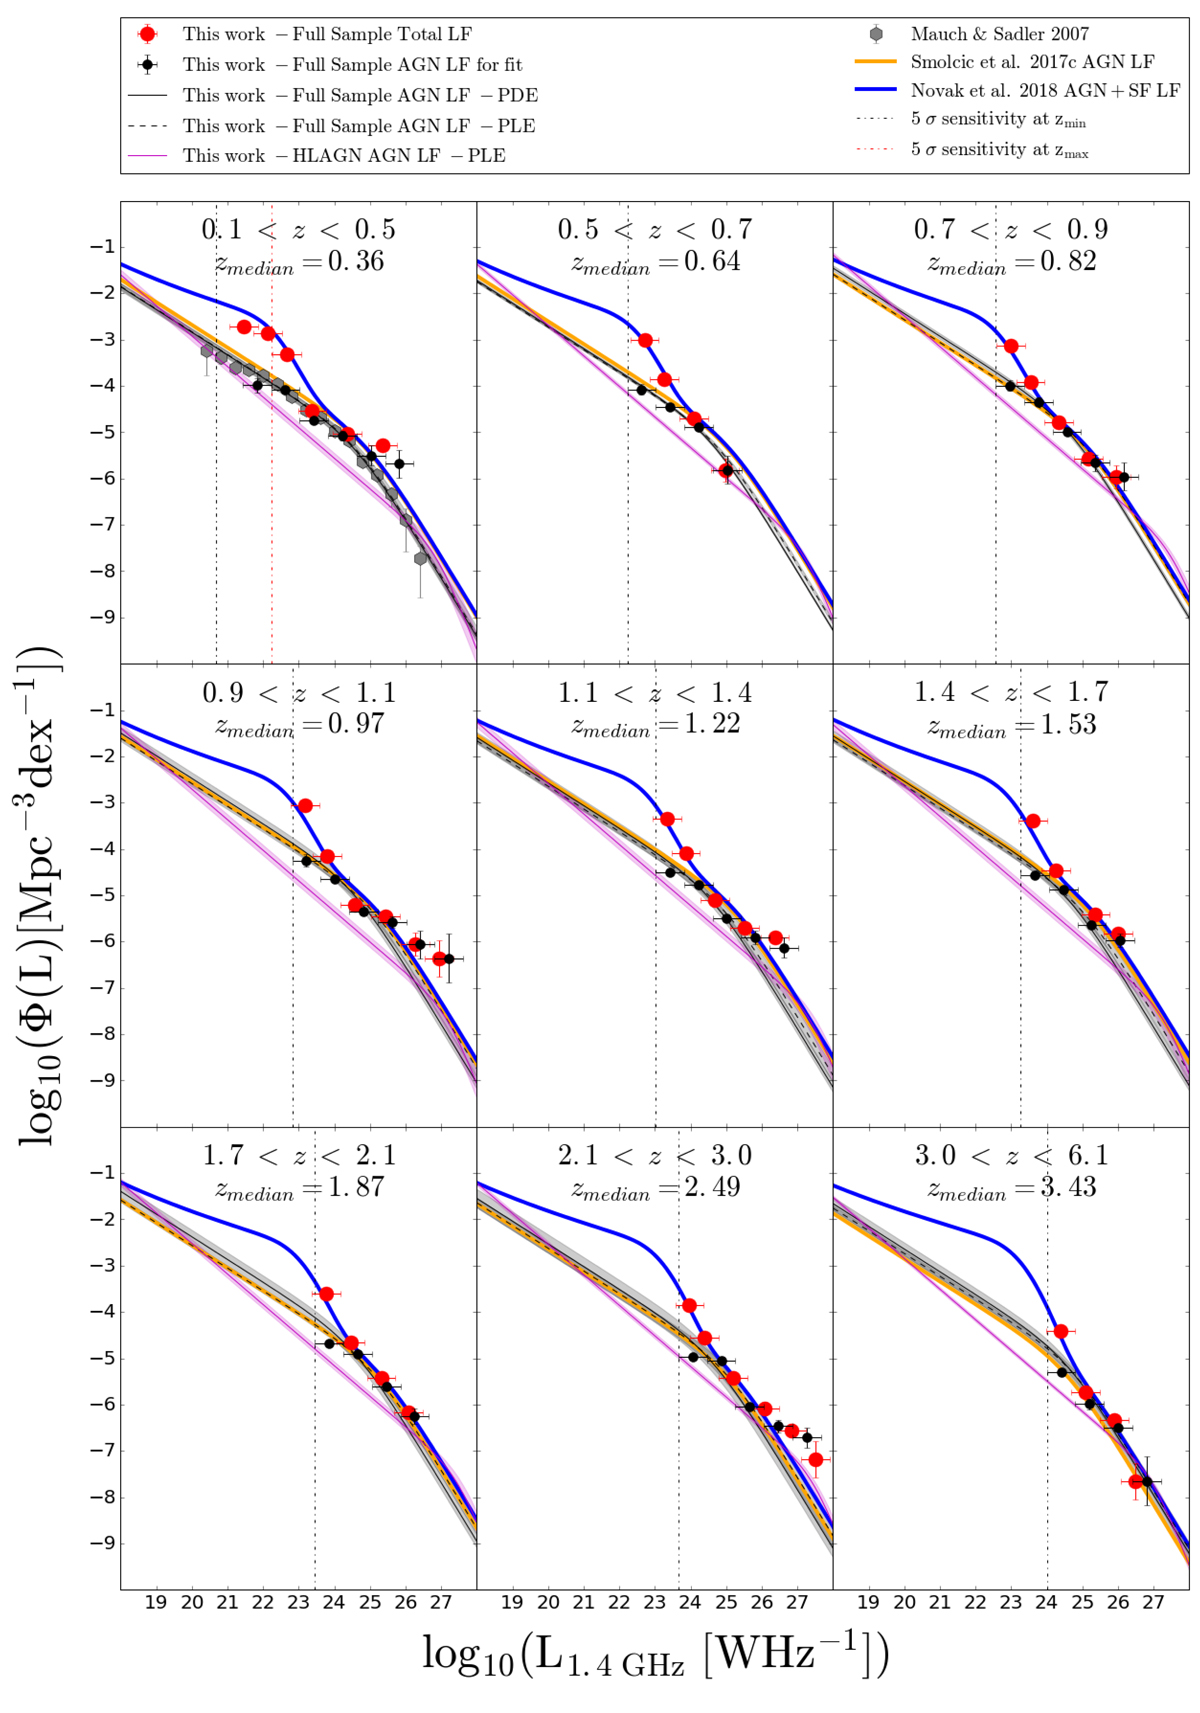
1.4 GHz AGN luminosity function of the full VLA-COSMOS 3 GHz Large Project sample with COSMOS2015 counterparts out to z ∼ 6. The AGN and total luminosity functions are shown with black and red circles, respectively. Solid and dashed black lines show the fit of analytic local AGN luminosity function in PDE and PLE models, respectively, with shaded areas indicating 1σ confidence range. The black and red vertical dashed lines show the luminosity corresponding to the 5σ sensitivity at zmin and zmax of the redshift bin, respectively. Results from the literature are also shown, as detailed in the legend.
Current usage metrics show cumulative count of Article Views (full-text article views including HTML views, PDF and ePub downloads, according to the available data) and Abstracts Views on Vision4Press platform.
Data correspond to usage on the plateform after 2015. The current usage metrics is available 48-96 hours after online publication and is updated daily on week days.
Initial download of the metrics may take a while.