Fig. 1.
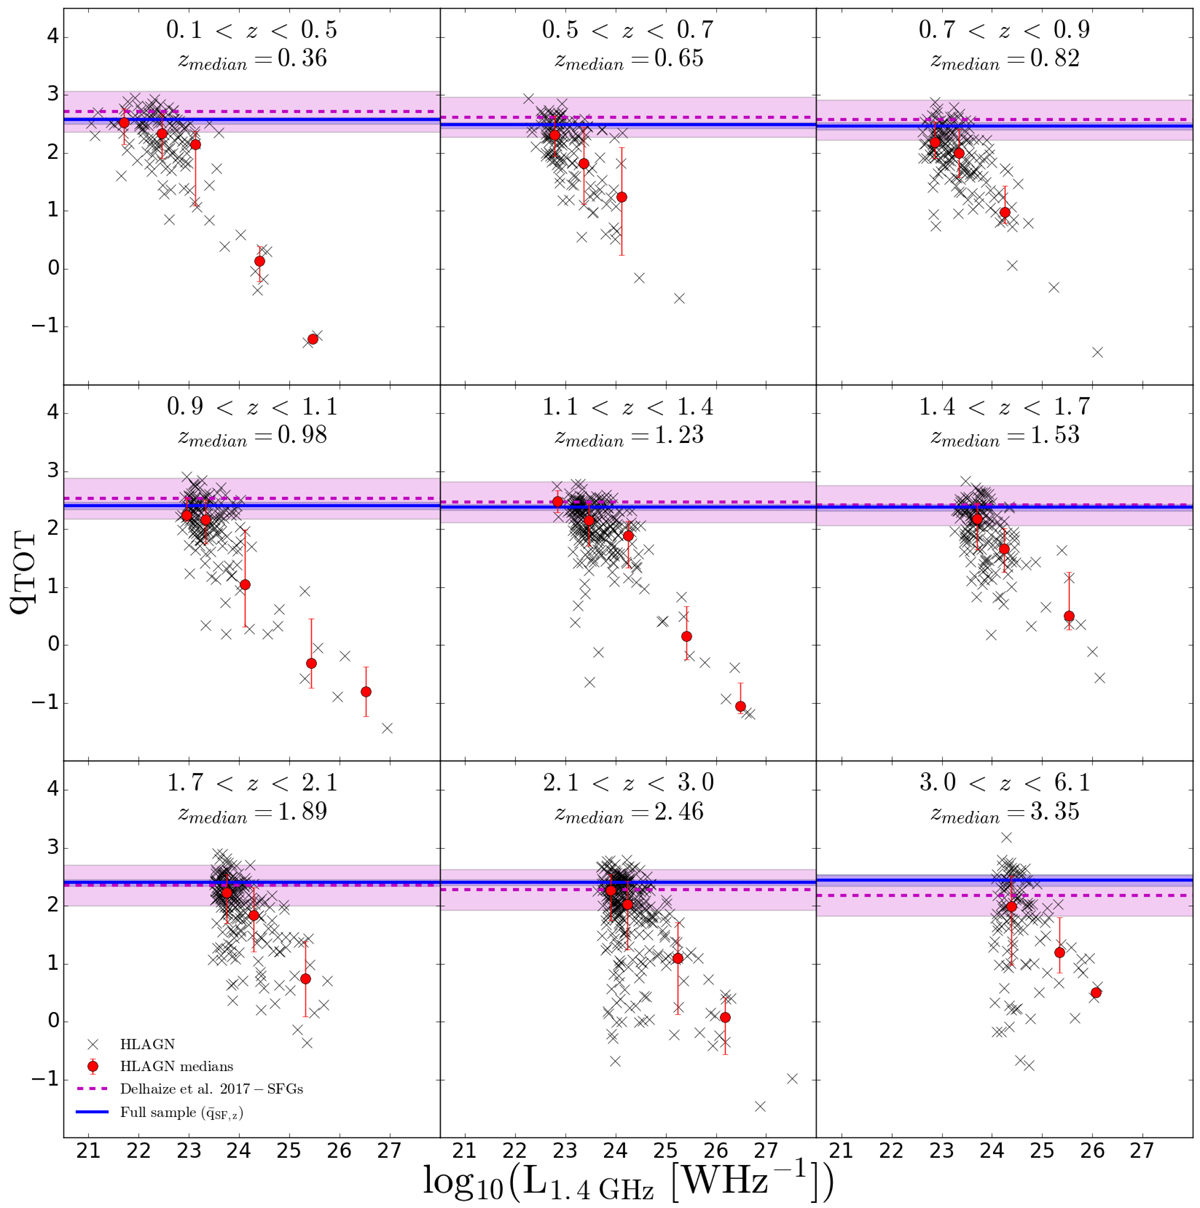
Infrared-to-1.4 GHz radio luminosity ratio (qTOT) vs. L1.4 GHz for HLAGN (black crosses). Radio luminosity binned median values of the ratio are shown with red circles with error bars showing 16th and 84th percentiles of the distribution. The dashed magenta line corresponds to the IRRC derived by Delhaize et al. (2017) at the median redshift of the underlying HLAGN sample, along with its 1σ spread of ±0.35 dex. Blue solid lines and area show the median of the star-forming peak q̄SF,z and 1σq SF,z uncertainties calibrated on the full radio detected sample of the VLA-COSMOS 3 GHz Large Project sources with the COSMOS2015 counterparts.
Current usage metrics show cumulative count of Article Views (full-text article views including HTML views, PDF and ePub downloads, according to the available data) and Abstracts Views on Vision4Press platform.
Data correspond to usage on the plateform after 2015. The current usage metrics is available 48-96 hours after online publication and is updated daily on week days.
Initial download of the metrics may take a while.