Fig. 9.
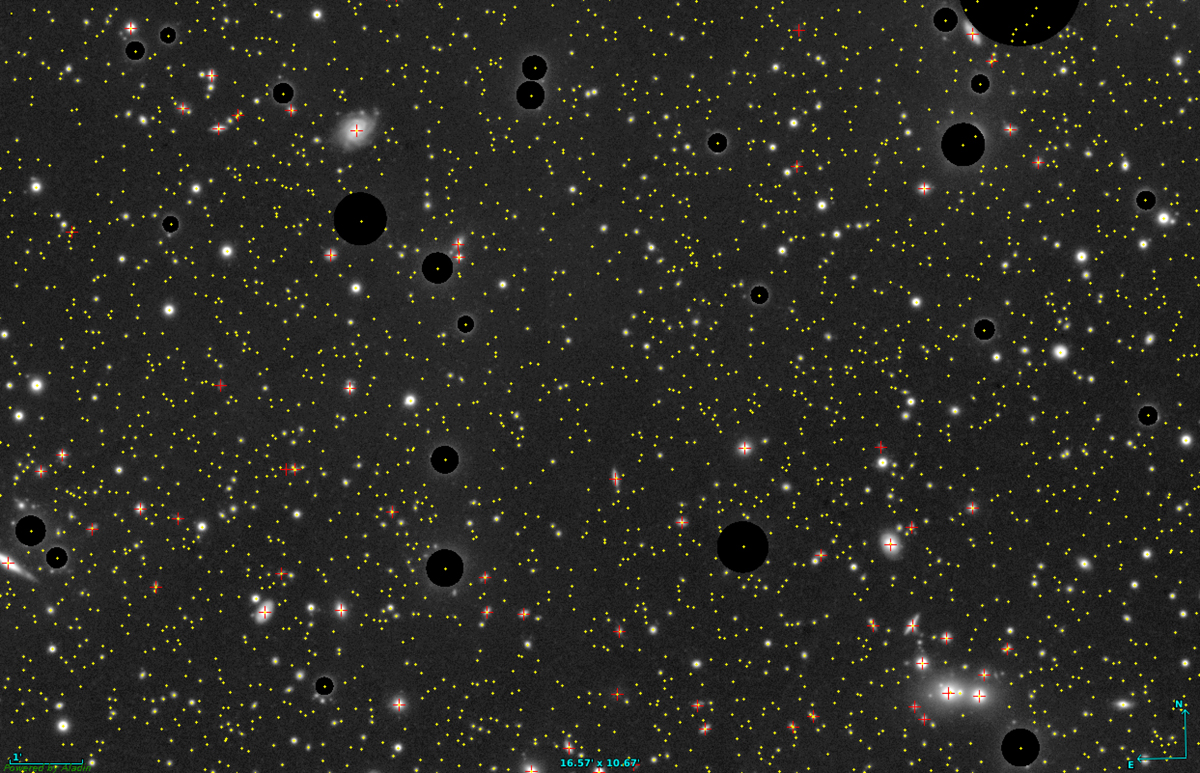
Magnification of Field 5 with the detected objects and masks (black circles) overlaid on the image. The yellow points and red symbols correspond to the initial detections of our detection algorithm, and the objects that pass the A_IMAGE > 2 arcsec selection limit, respectively. Aladin (Bonnarel et al. 2000) was used for generating the image. The image is best viewed in color on-screen.
Current usage metrics show cumulative count of Article Views (full-text article views including HTML views, PDF and ePub downloads, according to the available data) and Abstracts Views on Vision4Press platform.
Data correspond to usage on the plateform after 2015. The current usage metrics is available 48-96 hours after online publication and is updated daily on week days.
Initial download of the metrics may take a while.