Fig. 8.
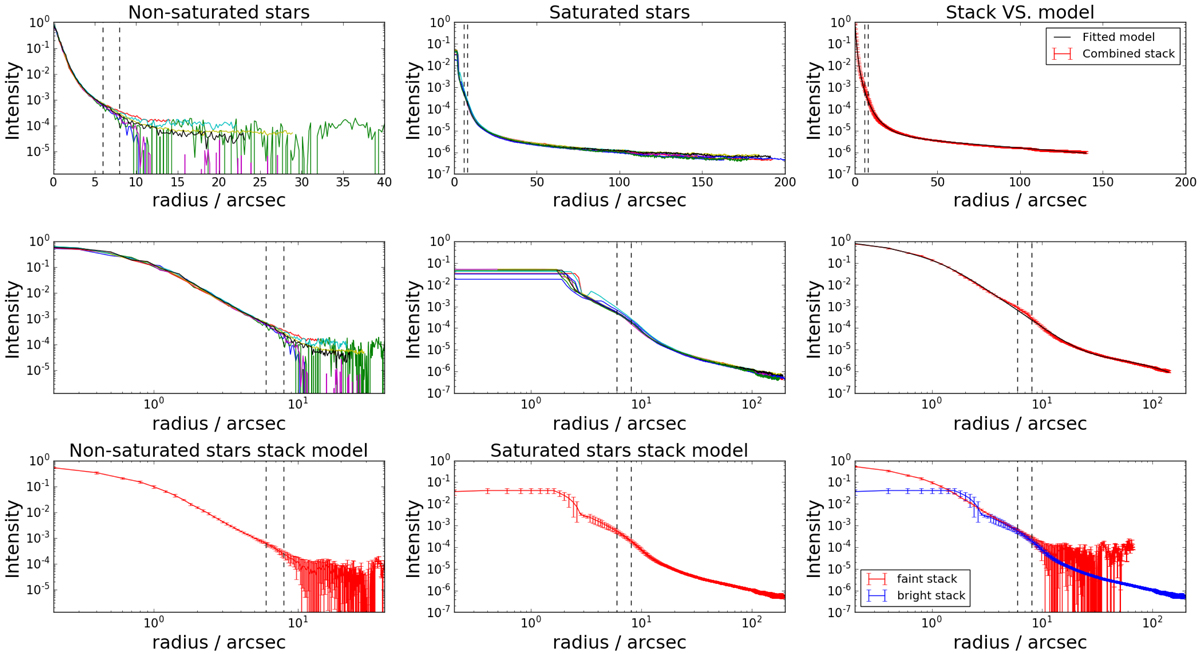
Left panels: scaled luminosity profiles of the non-saturated stars of field 11 as a function of radius, shown in linear (top left) and logarithmic (middle left) scale. The different colors correspond to different stars. In the lowest panel the stack constructed from the stars is shown. The errorbars indicate the scatter between individual stars. Middle panels: similar graphs for saturated stars of different fields. Top and middle right panels: comparisons of the full profiles derived from the observed stars (i.e., combined stack of faint and bright stars), and the corresponding fitted model. Bottom right panel: bright and faint stacks near the transition zone. The transition zone is shown in all panels using the vertical dashed lines.
Current usage metrics show cumulative count of Article Views (full-text article views including HTML views, PDF and ePub downloads, according to the available data) and Abstracts Views on Vision4Press platform.
Data correspond to usage on the plateform after 2015. The current usage metrics is available 48-96 hours after online publication and is updated daily on week days.
Initial download of the metrics may take a while.