Fig. 7.
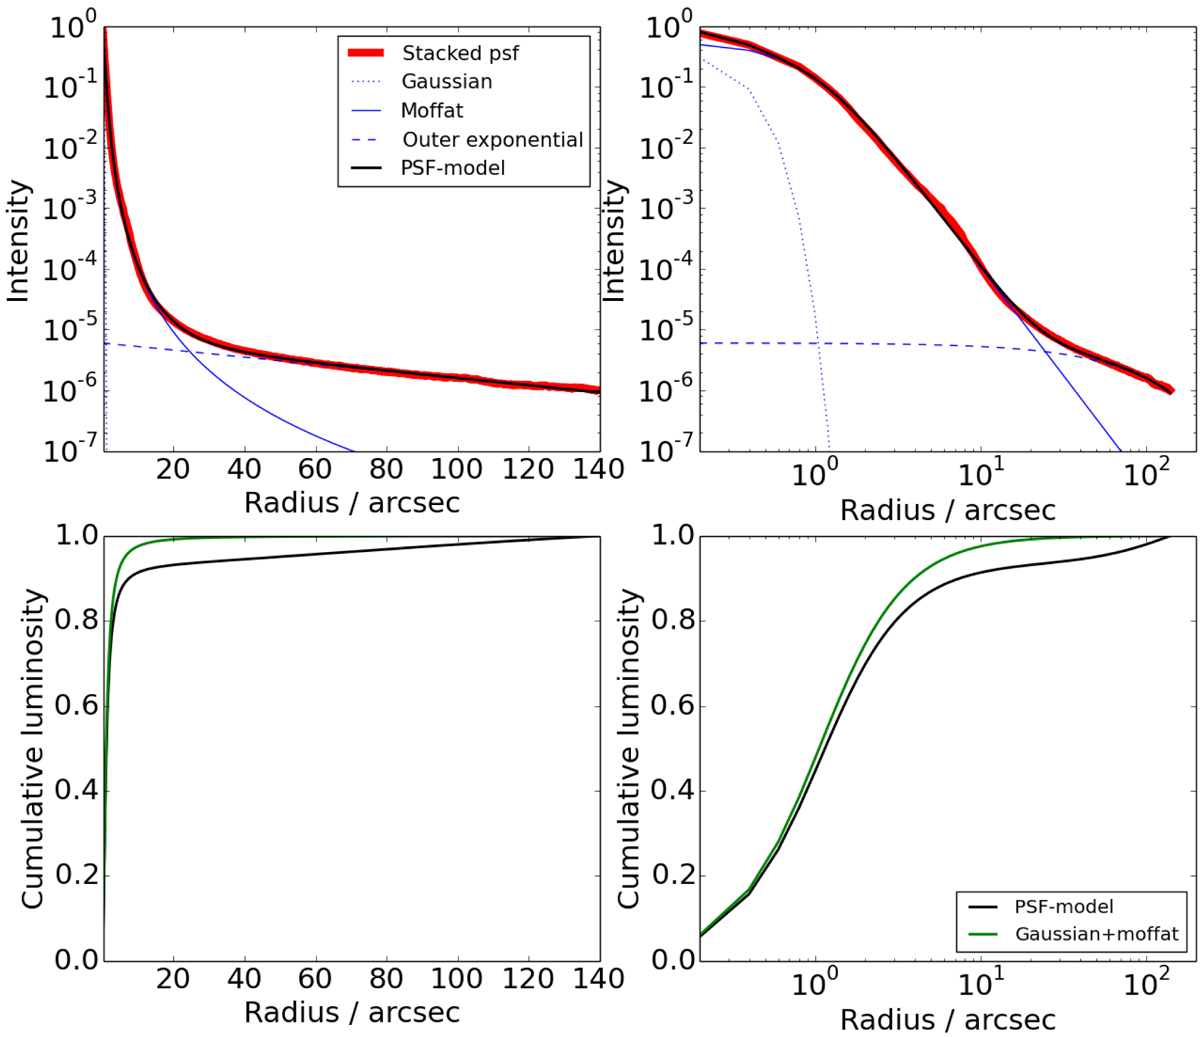
Upper left and right panels: stacked intensity profiles (red lines) against linear and logarithmic radius scale, respectively. Shown also are the analytic PSF model (black lines), the model created from the inner Gaussian (blue dotted line), Moffat model (blue solid line) and the fitted outer exponential function (blue dashed line). Left and right lower panels: cumulative luminosity fraction within a given radius in linear and logarithmic radial scales, respectively. The green line in the lower panels gives the cumulative flux for only the core part of the PSF (Gaussian + Moffat).
Current usage metrics show cumulative count of Article Views (full-text article views including HTML views, PDF and ePub downloads, according to the available data) and Abstracts Views on Vision4Press platform.
Data correspond to usage on the plateform after 2015. The current usage metrics is available 48-96 hours after online publication and is updated daily on week days.
Initial download of the metrics may take a while.