Fig. 5.
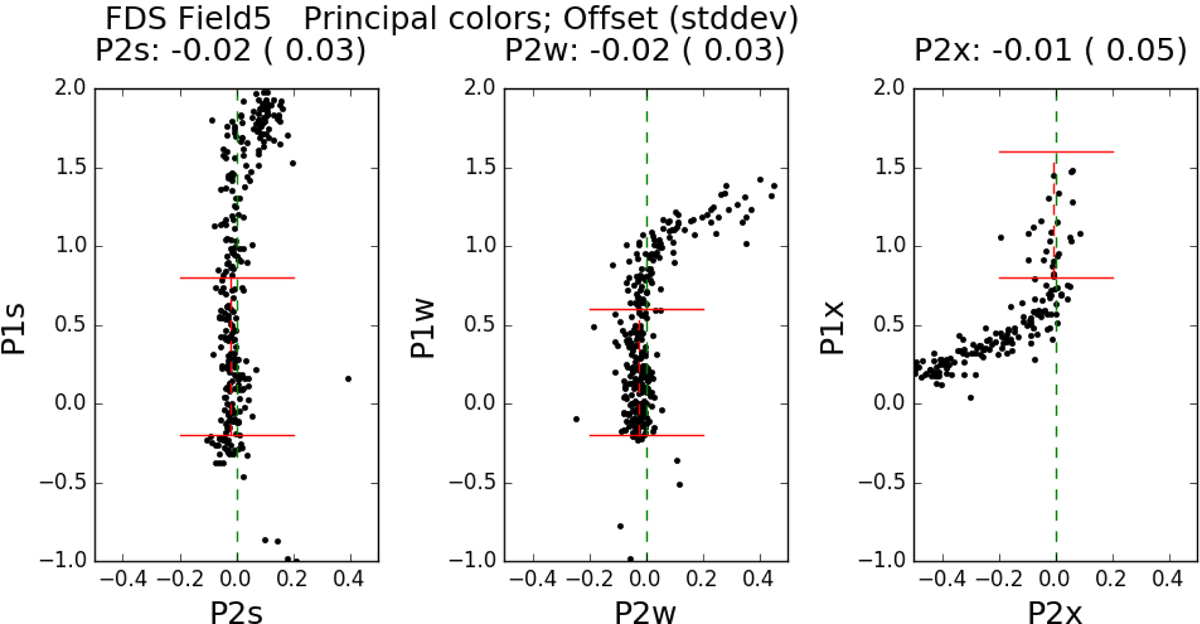
Stellar locii of the Milky Way stars shown along the three different principal color axes for the FDS Field 5. The dashed vertical lines show the zero offsets, and the horizontal red solid lines show the limits where the offsets and the standard deviations of the locii are measured.
Current usage metrics show cumulative count of Article Views (full-text article views including HTML views, PDF and ePub downloads, according to the available data) and Abstracts Views on Vision4Press platform.
Data correspond to usage on the plateform after 2015. The current usage metrics is available 48-96 hours after online publication and is updated daily on week days.
Initial download of the metrics may take a while.