Fig. 3.
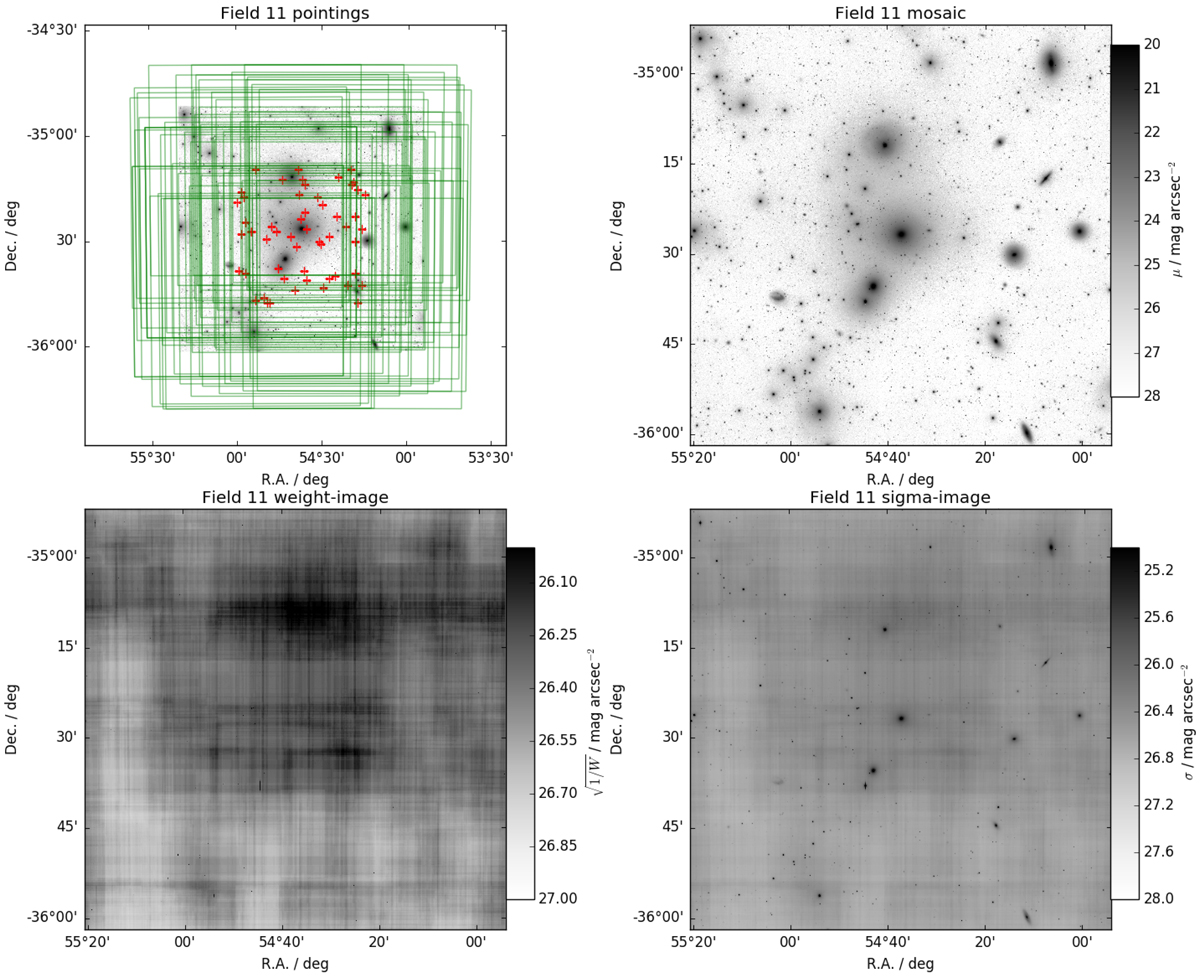
Coverage of the FDS field 11 observations in g′-band are shown with the green squares in the upper left panel, and the centers of the pointings with the red crosses. The median combined mosaic image is shown in the upper right corner, and the corresponding weight- and sigma-images are shown in the lower left and lower right panels, respectively. The color bars in the panels indicate the surface brightness and 1σ noise per pixel transformed into surface brightness, respectively.
Current usage metrics show cumulative count of Article Views (full-text article views including HTML views, PDF and ePub downloads, according to the available data) and Abstracts Views on Vision4Press platform.
Data correspond to usage on the plateform after 2015. The current usage metrics is available 48-96 hours after online publication and is updated daily on week days.
Initial download of the metrics may take a while.