Fig. D.3.
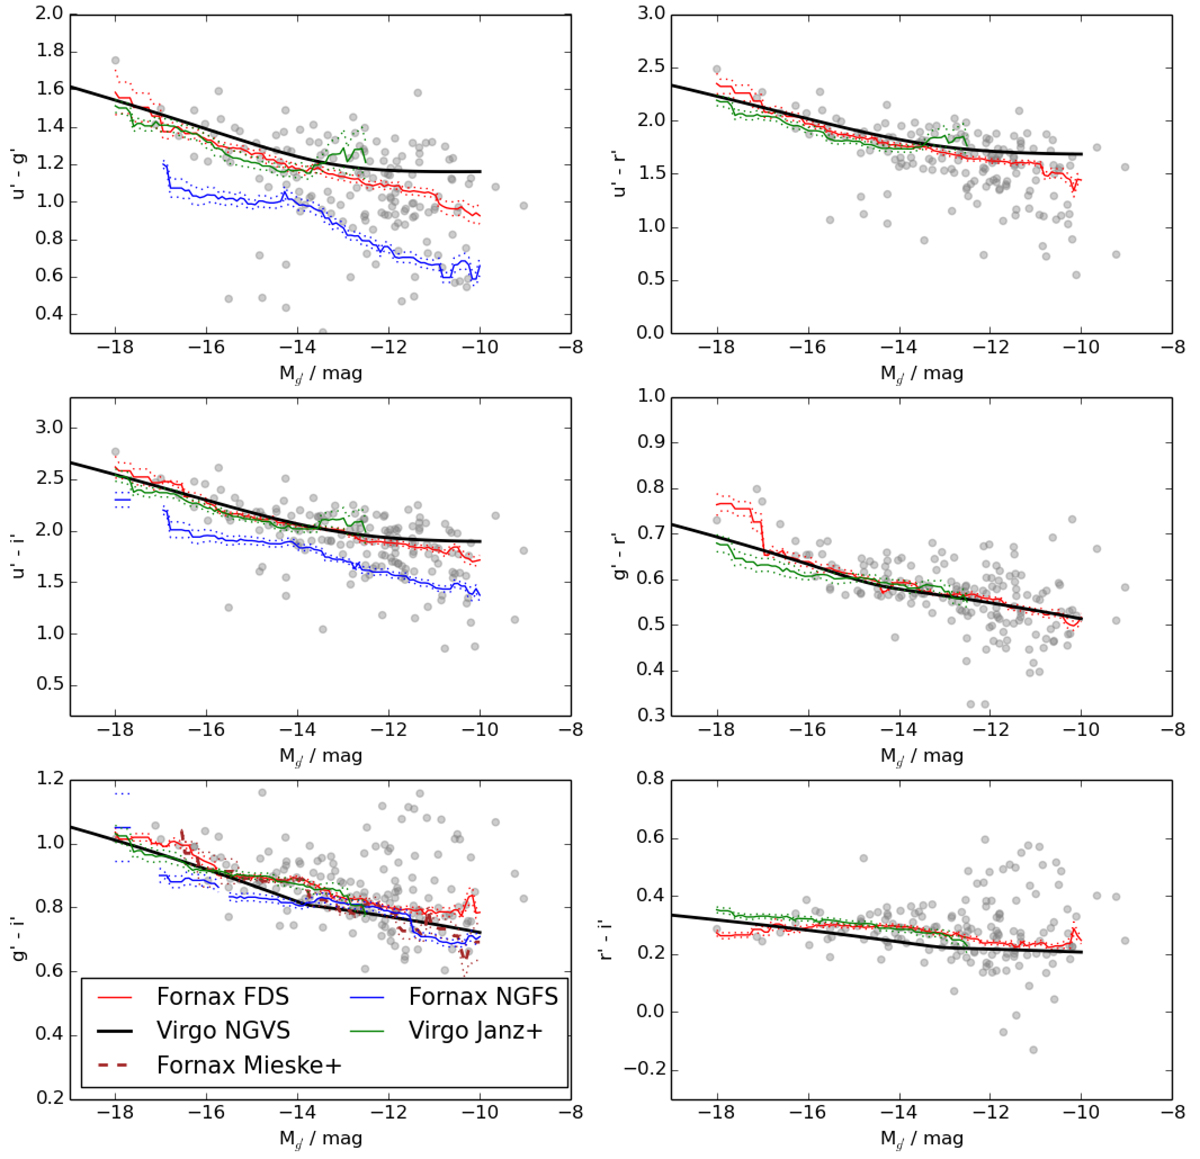
Color–magnitude relations of the early-type galaxies in our sample, within two core radii from the cluster center, are shown with the gray dots. The solid red lines show the running means of the colors measured with an interval of ΔMg′ = 1 mag, and the red dotted lines show the uncertainty of the mean. The blue solid line, the brown dashed line, and the green solid line show similarly the samples of NGFS Eigenthaler et al. (2018), Mieske et al. (2007), and Janz & Lisker (2009), respectively. The solid black lines show the color–magnitude relations of the Virgo early-type dwarf galaxies by Roediger et al. (2017).
Current usage metrics show cumulative count of Article Views (full-text article views including HTML views, PDF and ePub downloads, according to the available data) and Abstracts Views on Vision4Press platform.
Data correspond to usage on the plateform after 2015. The current usage metrics is available 48-96 hours after online publication and is updated daily on week days.
Initial download of the metrics may take a while.