Fig. 22.
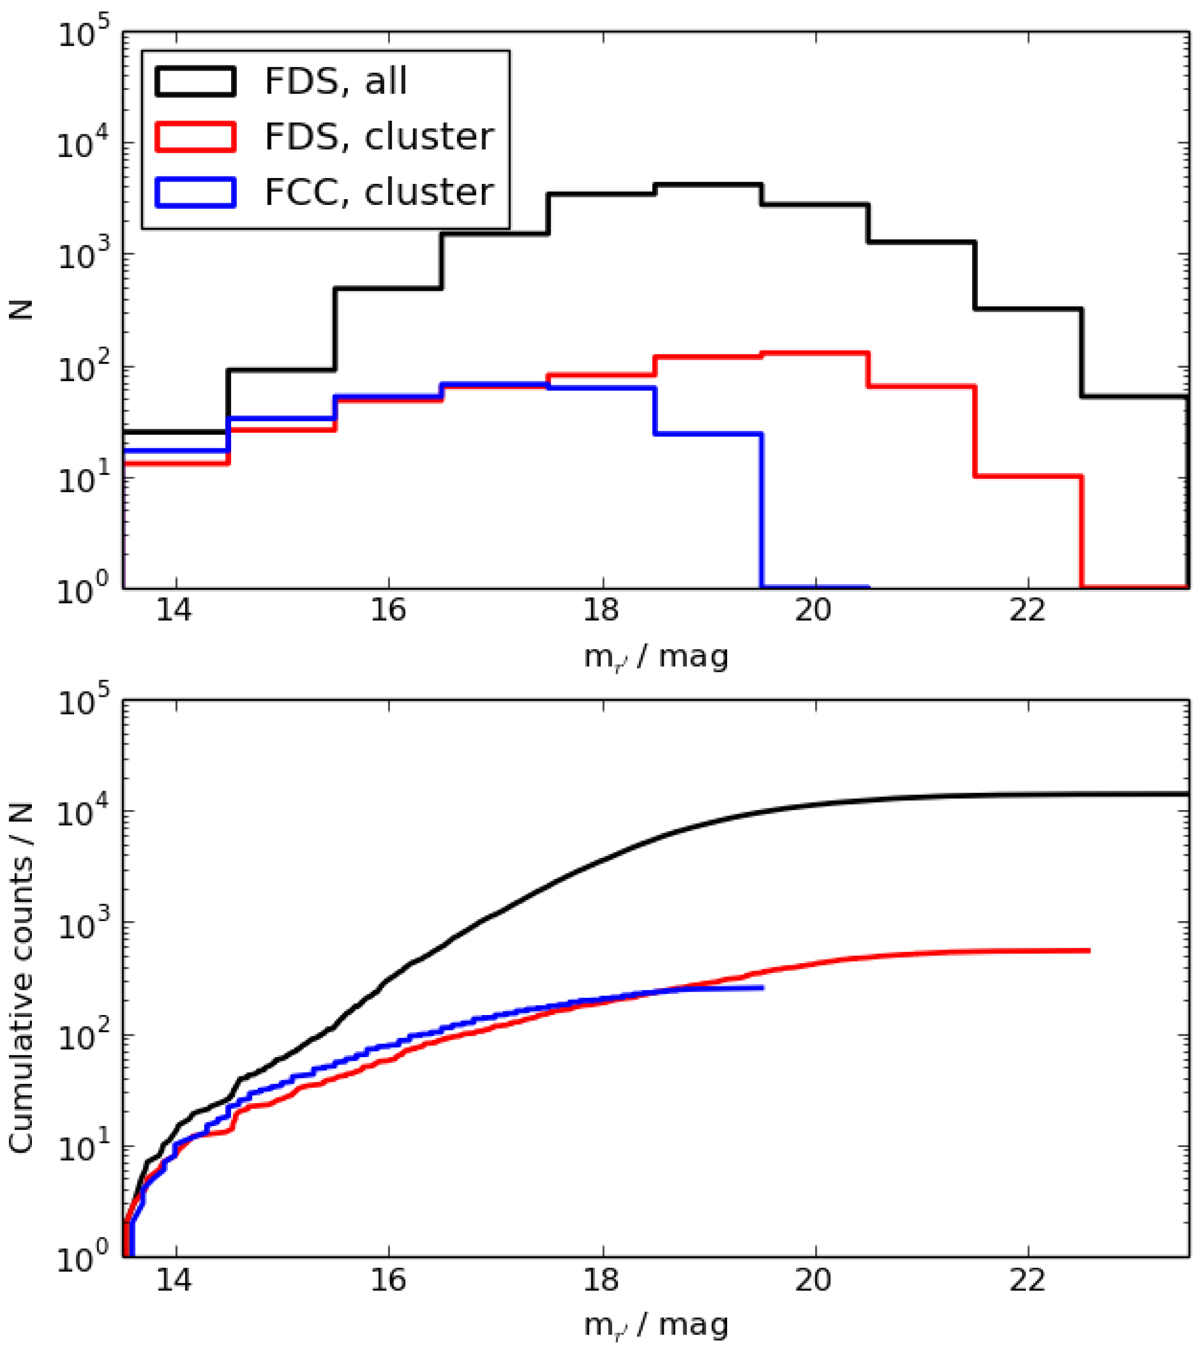
Upper panel: distribution of the apparent r′-band magnitudes of in FCC (the blue histogram), compared to the ones detected in this work. We show the distribution of the galaxies classified as likely cluster dwarfs with the red histogram and the one of the likely background galaxies with the black histogram. Lower panel: same distributions in a cumulative profile. The FCC magnitudes are transformed from the B-band to r′-band using the mean color difference of ⟨B − r′⟩ = 1 mag defined comparing our values with the ones of FCC.
Current usage metrics show cumulative count of Article Views (full-text article views including HTML views, PDF and ePub downloads, according to the available data) and Abstracts Views on Vision4Press platform.
Data correspond to usage on the plateform after 2015. The current usage metrics is available 48-96 hours after online publication and is updated daily on week days.
Initial download of the metrics may take a while.