Fig. 17.
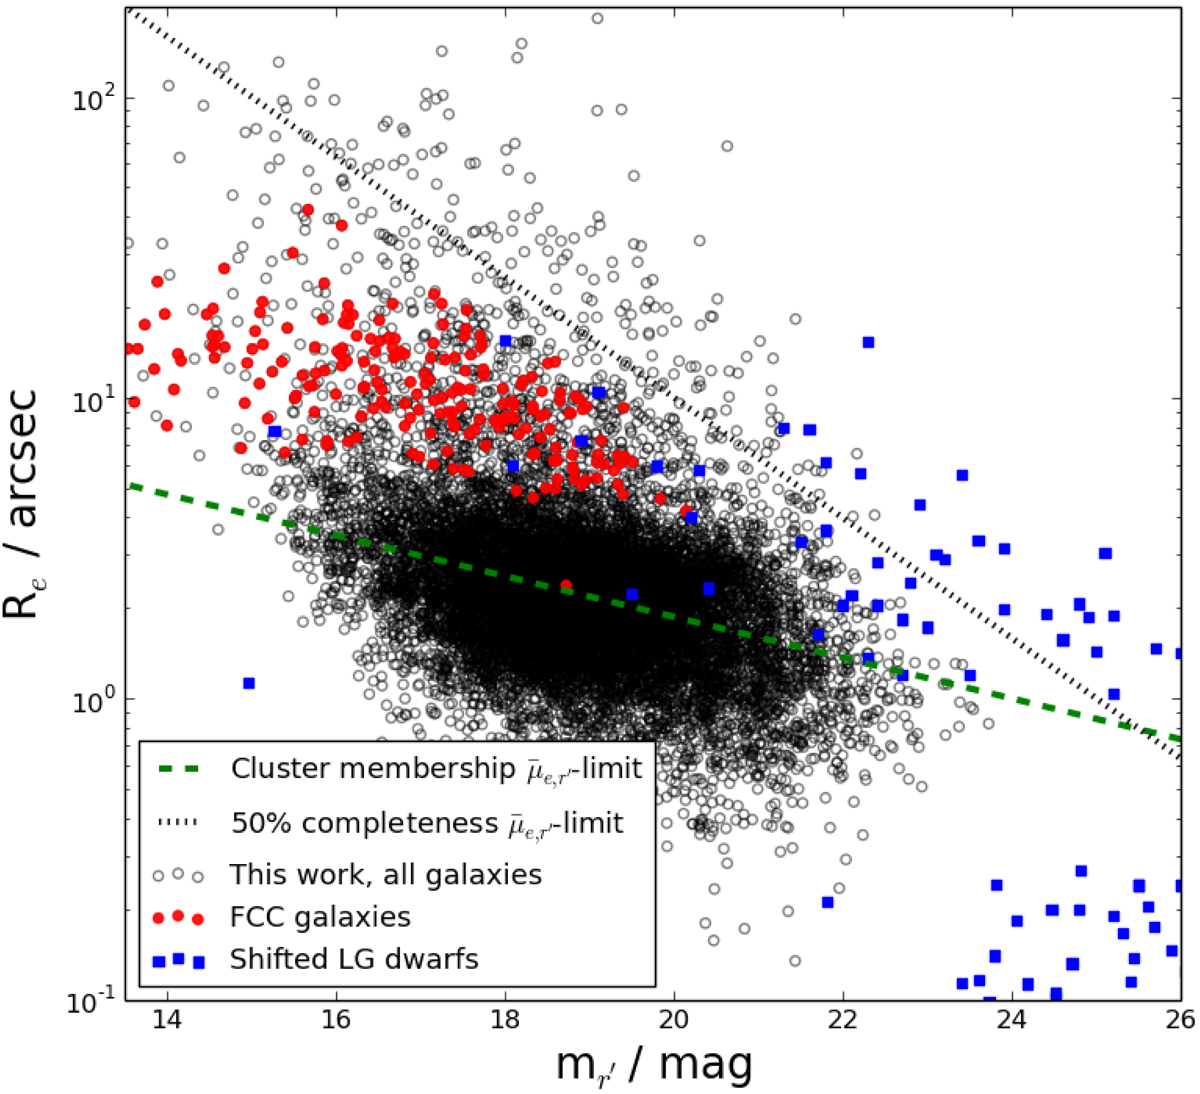
Comparison of our surface brightness selection cut (green dashed line) described in Sect. 8.2.2 with the size-magnitude relation of the galaxies in our sample (black and red symbols), and in the local group galaxies of Brodie et al. (2011) after shifting them to the distance of the Fornax cluster (blue squares). The red points show the galaxies in our sample that are classified as likely cluster members by Ferguson (1989). The gray dotted line shows our 50% surface brightness completeness limit of ![]() mag arcsec−2. As the blue squares are mostly above the surface brightness selection limit, we would not exclude similar galaxies in the Fornax cluster from our sample by applying the selection limit. The blue squares appearing in the bottom right corner are star cluster like objects that would appear as point sources at the distance of the Fornax cluster.
mag arcsec−2. As the blue squares are mostly above the surface brightness selection limit, we would not exclude similar galaxies in the Fornax cluster from our sample by applying the selection limit. The blue squares appearing in the bottom right corner are star cluster like objects that would appear as point sources at the distance of the Fornax cluster.
Current usage metrics show cumulative count of Article Views (full-text article views including HTML views, PDF and ePub downloads, according to the available data) and Abstracts Views on Vision4Press platform.
Data correspond to usage on the plateform after 2015. The current usage metrics is available 48-96 hours after online publication and is updated daily on week days.
Initial download of the metrics may take a while.