Fig. 16.
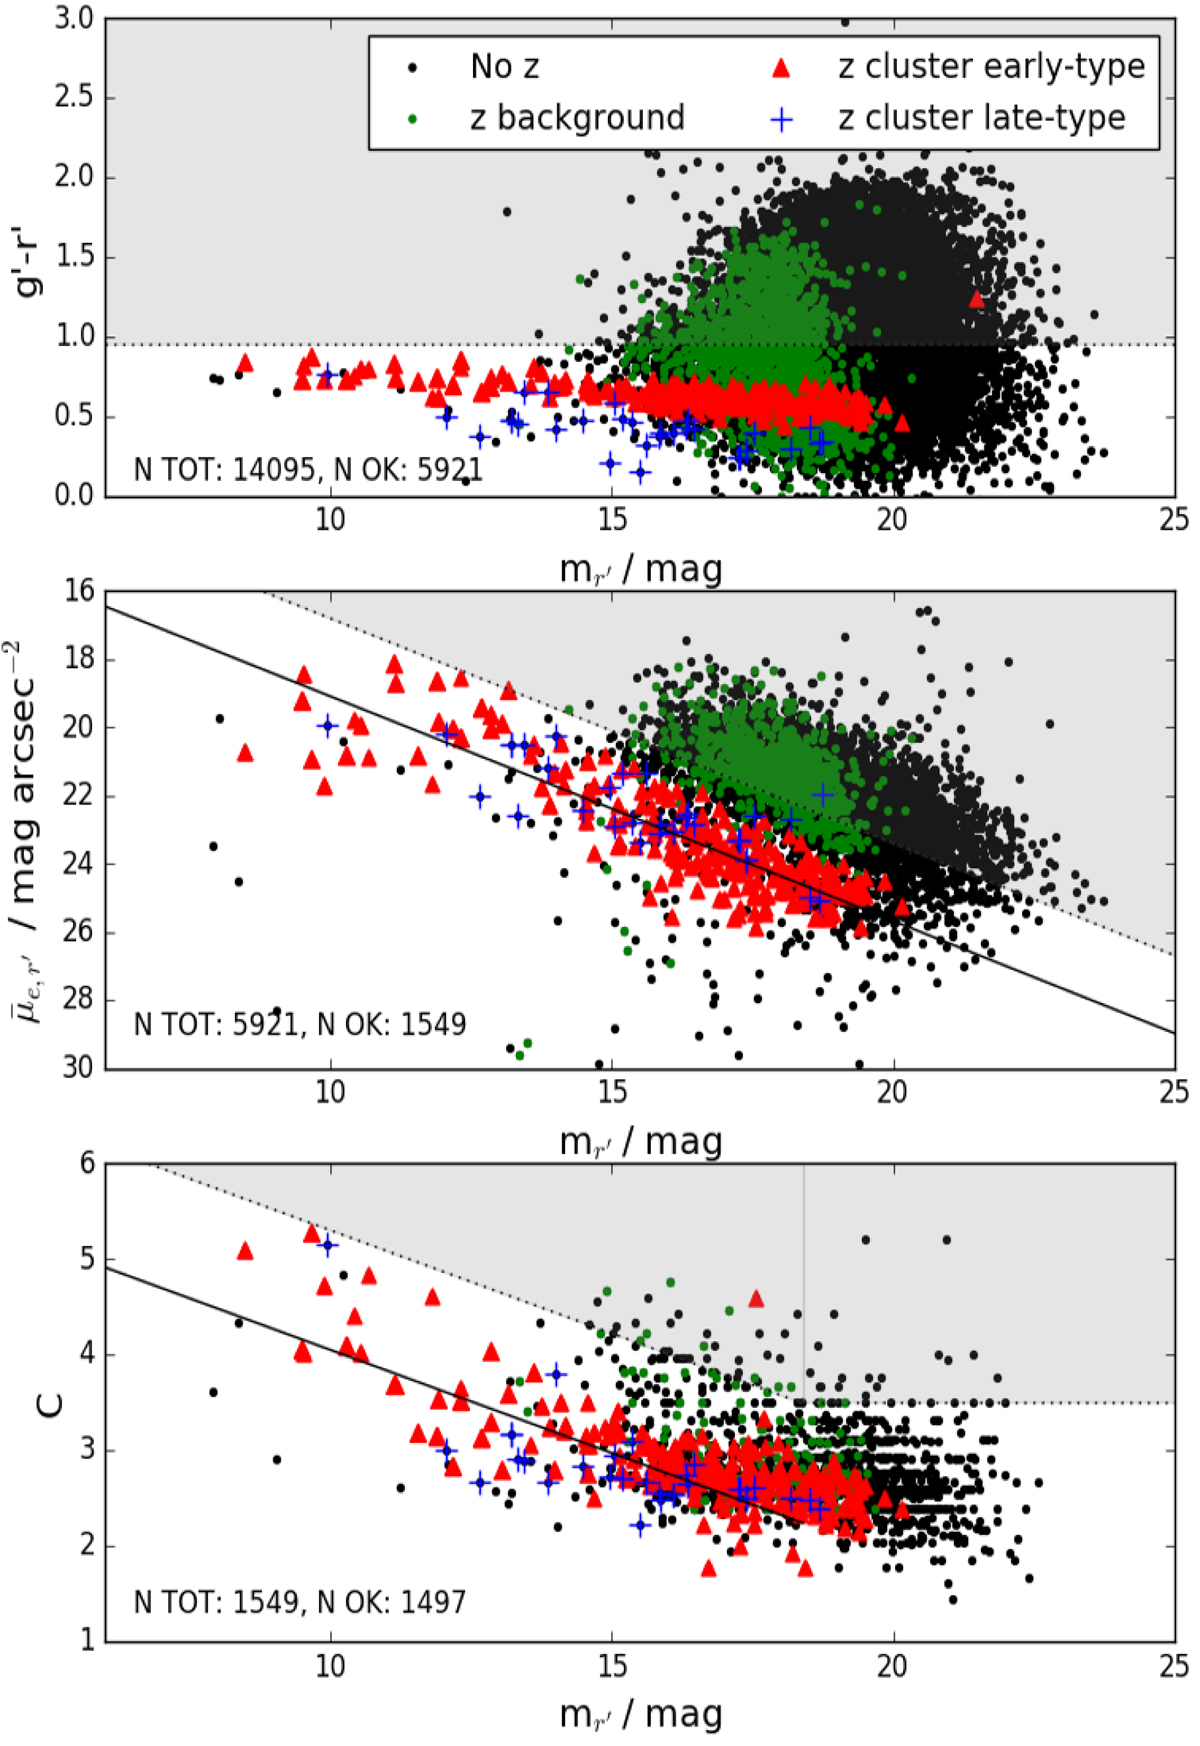
Illustration of our main criteria for distinguishing the cluster and background galaxies from each other. The panels from top to bottom show how the g′−r′ color (also g′−i′ cut was used which looks very similar), the mean effective surface brightness ![]() , and the concentration parameter C of the spectrally confirmed (Drinkwater et al. 2000) early- (red symbols) and late-type (blue symbols) cluster and background galaxies (green symbols), scale with the r′-band apparent magnitude (mr′). The solid lines show the fits to the early-type Fornax cluster galaxies, and the dotted lines show the selection limits. The excluded areas are shaded with gray. The black dots correspond to objects with no spectra available. The numbers in each plot correspond to the total number of galaxies before the cut, and the number of galaxies that remain after the cut. The two lower panels show only the galaxies that have not been excluded in the previous steps.
, and the concentration parameter C of the spectrally confirmed (Drinkwater et al. 2000) early- (red symbols) and late-type (blue symbols) cluster and background galaxies (green symbols), scale with the r′-band apparent magnitude (mr′). The solid lines show the fits to the early-type Fornax cluster galaxies, and the dotted lines show the selection limits. The excluded areas are shaded with gray. The black dots correspond to objects with no spectra available. The numbers in each plot correspond to the total number of galaxies before the cut, and the number of galaxies that remain after the cut. The two lower panels show only the galaxies that have not been excluded in the previous steps.
Current usage metrics show cumulative count of Article Views (full-text article views including HTML views, PDF and ePub downloads, according to the available data) and Abstracts Views on Vision4Press platform.
Data correspond to usage on the plateform after 2015. The current usage metrics is available 48-96 hours after online publication and is updated daily on week days.
Initial download of the metrics may take a while.