Fig. 14.
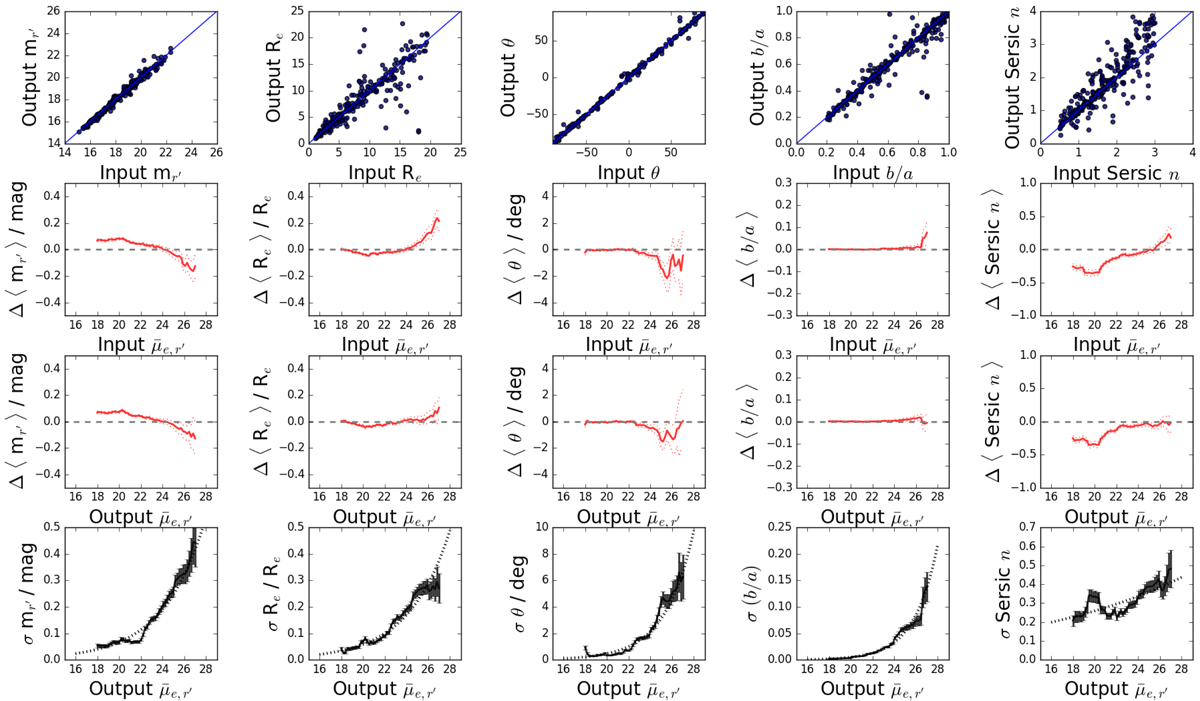
Top row panels: comparison of the input structural parameters of the mock galaxies to the values measured by our photometric pipeline. The shown parameters are apparent magnitude (mr′), effective radius in arcsec (Re), position angle (θ), axis ratio (b/a), and Sérsic index (n), and the blue diagonal lines represent the 1:1 ratio. Second and third row panels: mean differences between the input and output parameters (input – output) as a function of their input and output mean effective r′-band surface brightness, ![]() , respectively. Bottom row: standard deviations of the input – output parameter differences as a function of the input mean
, respectively. Bottom row: standard deviations of the input – output parameter differences as a function of the input mean ![]() . The dotted lines in the bottom row panels show the fits to the standard deviations as defined in Eq. (10).
. The dotted lines in the bottom row panels show the fits to the standard deviations as defined in Eq. (10).
Current usage metrics show cumulative count of Article Views (full-text article views including HTML views, PDF and ePub downloads, according to the available data) and Abstracts Views on Vision4Press platform.
Data correspond to usage on the plateform after 2015. The current usage metrics is available 48-96 hours after online publication and is updated daily on week days.
Initial download of the metrics may take a while.