Fig. 13.
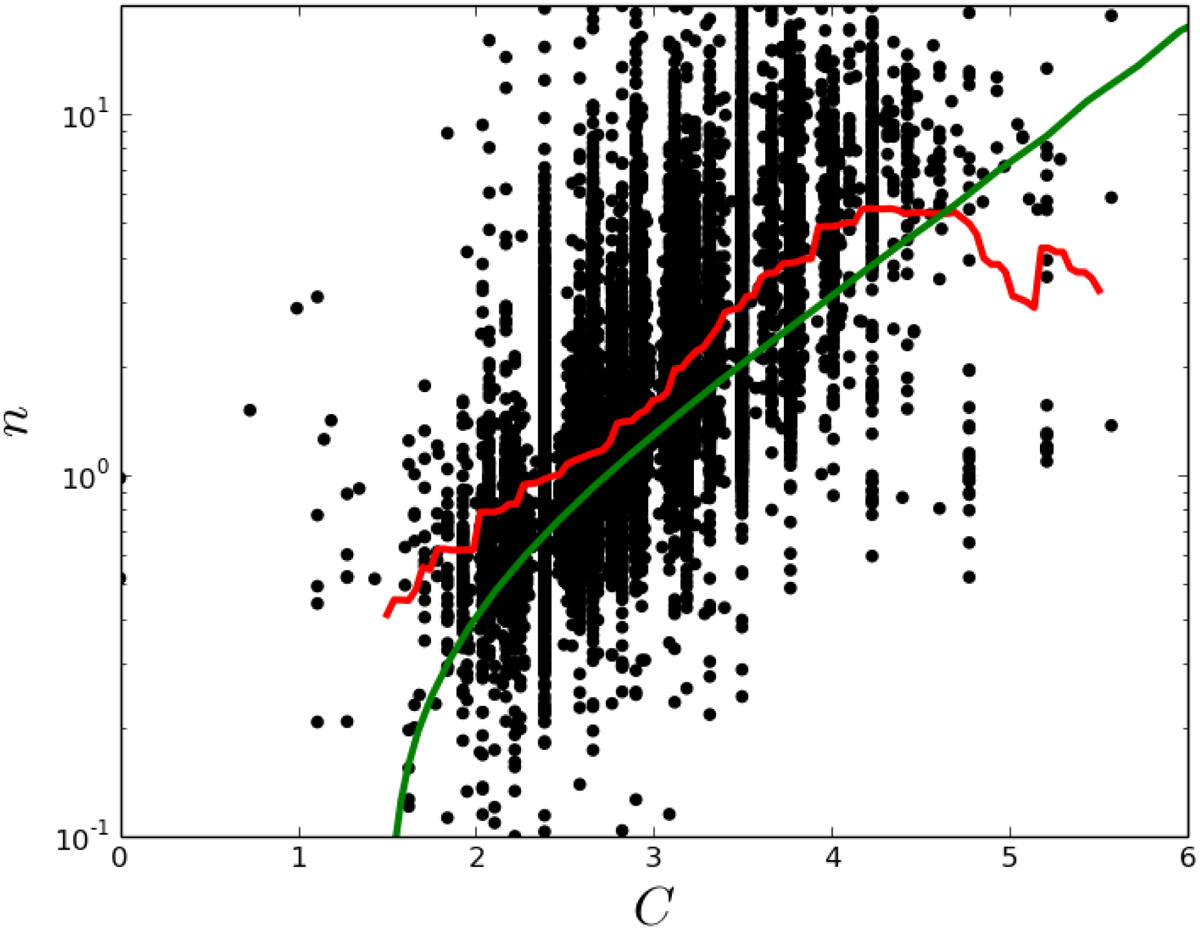
Values of the Sérsic index n and the concentration parameter C, measured in r′-band for all the objects in our catalog. The red line shows the running mean of the points (![]() was used) along the x-axis within intervals of ΔC = 0.5, and the green line shows the relation for a pure Sérsic profile.
was used) along the x-axis within intervals of ΔC = 0.5, and the green line shows the relation for a pure Sérsic profile.
Current usage metrics show cumulative count of Article Views (full-text article views including HTML views, PDF and ePub downloads, according to the available data) and Abstracts Views on Vision4Press platform.
Data correspond to usage on the plateform after 2015. The current usage metrics is available 48-96 hours after online publication and is updated daily on week days.
Initial download of the metrics may take a while.