Fig. 11.
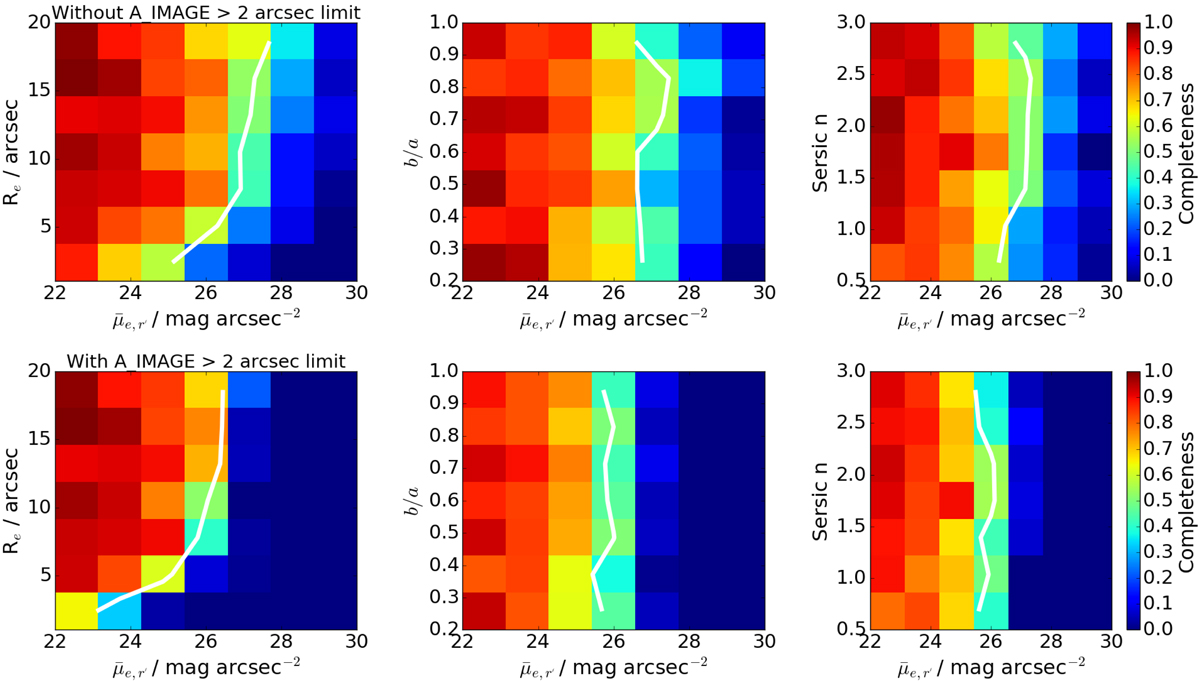
Detection efficiency of our detection algorithm is shown color-coded such that red means more efficient and blue less efficient. The detection efficiency is shown for the effective radius (Re), axis ratio (b/a), and Sersic index (n), as a function of the galaxy mean effective surface brightness (![]() ). The upper row shows the detection efficiency without applying the minimum size limit of A_IMAGE of 2 arcsec, and the lower row shows the detection efficiency after applying the limit. The white line shows the 50% completeness limit.
). The upper row shows the detection efficiency without applying the minimum size limit of A_IMAGE of 2 arcsec, and the lower row shows the detection efficiency after applying the limit. The white line shows the 50% completeness limit.
Current usage metrics show cumulative count of Article Views (full-text article views including HTML views, PDF and ePub downloads, according to the available data) and Abstracts Views on Vision4Press platform.
Data correspond to usage on the plateform after 2015. The current usage metrics is available 48-96 hours after online publication and is updated daily on week days.
Initial download of the metrics may take a while.