Fig. 1.
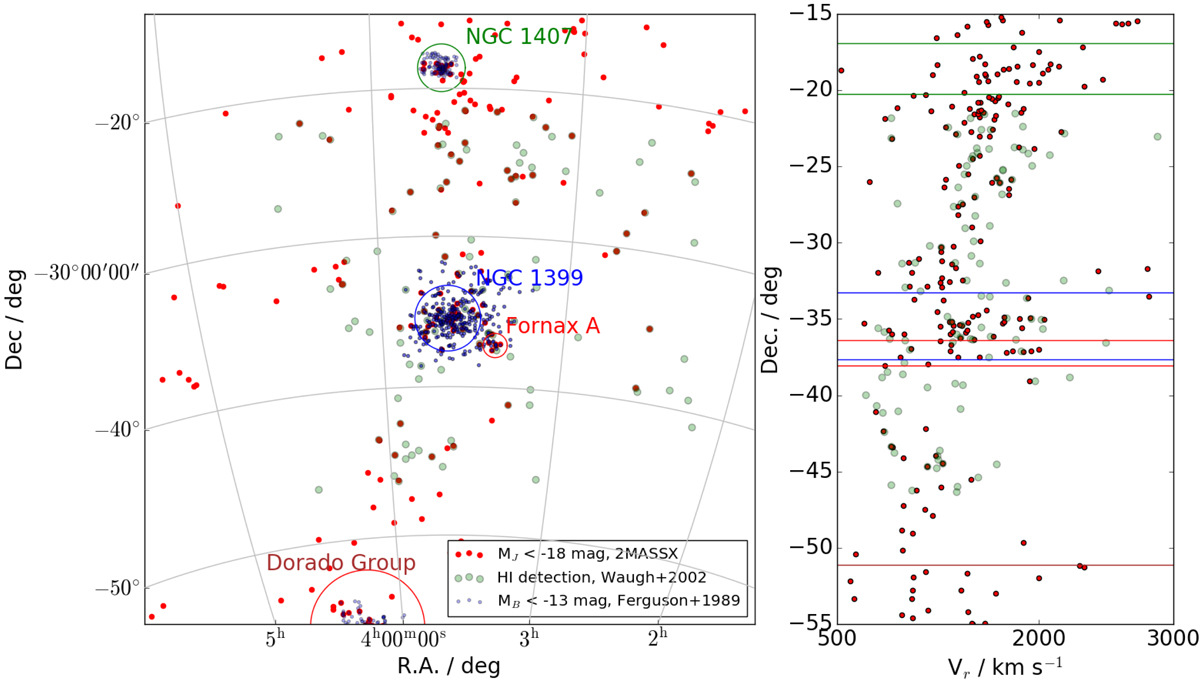
Large scale structure surrounding the Fornax cluster. Left panel: galaxy right ascension and declination in International Celestial Reference System (ICRS) coordinates, and right panel: recession velocities of the galaxies as a function of declination. At the distance of the Fornax cluster 1 deg corresponds to 0.3 Mpc, and 1000 km s−1 velocity difference due to Hubble flow corresponds to 14 Mpc (to first order independent of the distance). The galaxies with recession velocities Vr < 4000 km s−1 in the 2 Micron All Sky Survey catalog (2MASSX; Huchra et al. 2012), are plotted with the red dots, and the galaxies with velocities Vr < 4000 km s−1 from Waugh et al. (2002) with the green circles. The FCC galaxies are shown with blue dots. We also indicate the virial radii of the most significant groups in the surroundings of the Fornax cluster with the large circles, and show their names with the corresponding colors. The locations of the circles of the left panel are shown by the horizontal lines in the right panel using the corresponding colors.
Current usage metrics show cumulative count of Article Views (full-text article views including HTML views, PDF and ePub downloads, according to the available data) and Abstracts Views on Vision4Press platform.
Data correspond to usage on the plateform after 2015. The current usage metrics is available 48-96 hours after online publication and is updated daily on week days.
Initial download of the metrics may take a while.