Fig. 4.
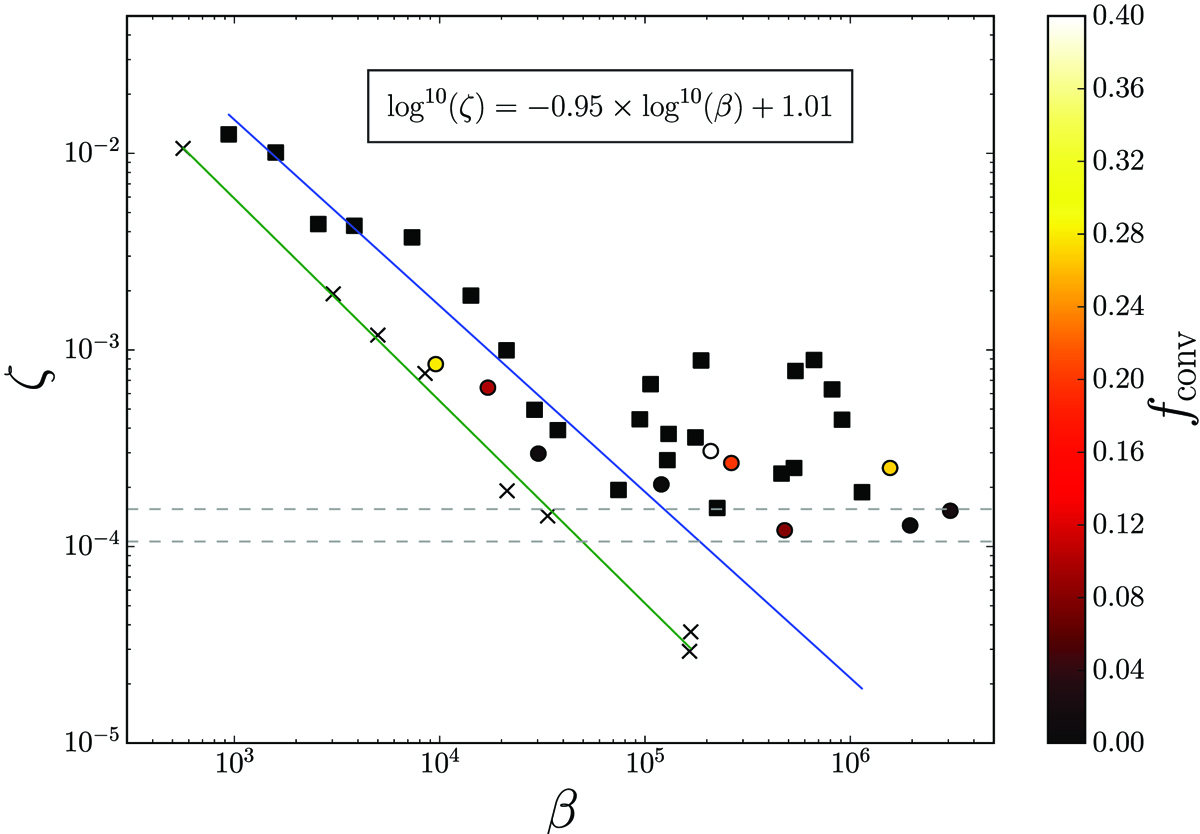
Squares denote cold branch simulations with a vertical extent Lz = 6H, and circles denote hot branch simulations with a vertical extent Lz = 12H. Crosses are used for cold branch simulations with the same box size as on the hot branch (results from those simulations are not reported in Table 1). The color indicates the value of fconv. Horizontal dotted gray lines show the value of ζ in ZNF simulations from S18 in a highly convective simulation of the hot branch (upper line) and a typical cold branch case (bottom line). The blue and green solid lines are linear fits to the points from the cold branch simulations with β ≲ 2 × 10⁴. This figure only reports results from simulations with Bz0 = 0.8, 2, and 8 G.
Current usage metrics show cumulative count of Article Views (full-text article views including HTML views, PDF and ePub downloads, according to the available data) and Abstracts Views on Vision4Press platform.
Data correspond to usage on the plateform after 2015. The current usage metrics is available 48-96 hours after online publication and is updated daily on week days.
Initial download of the metrics may take a while.