Fig. 1.
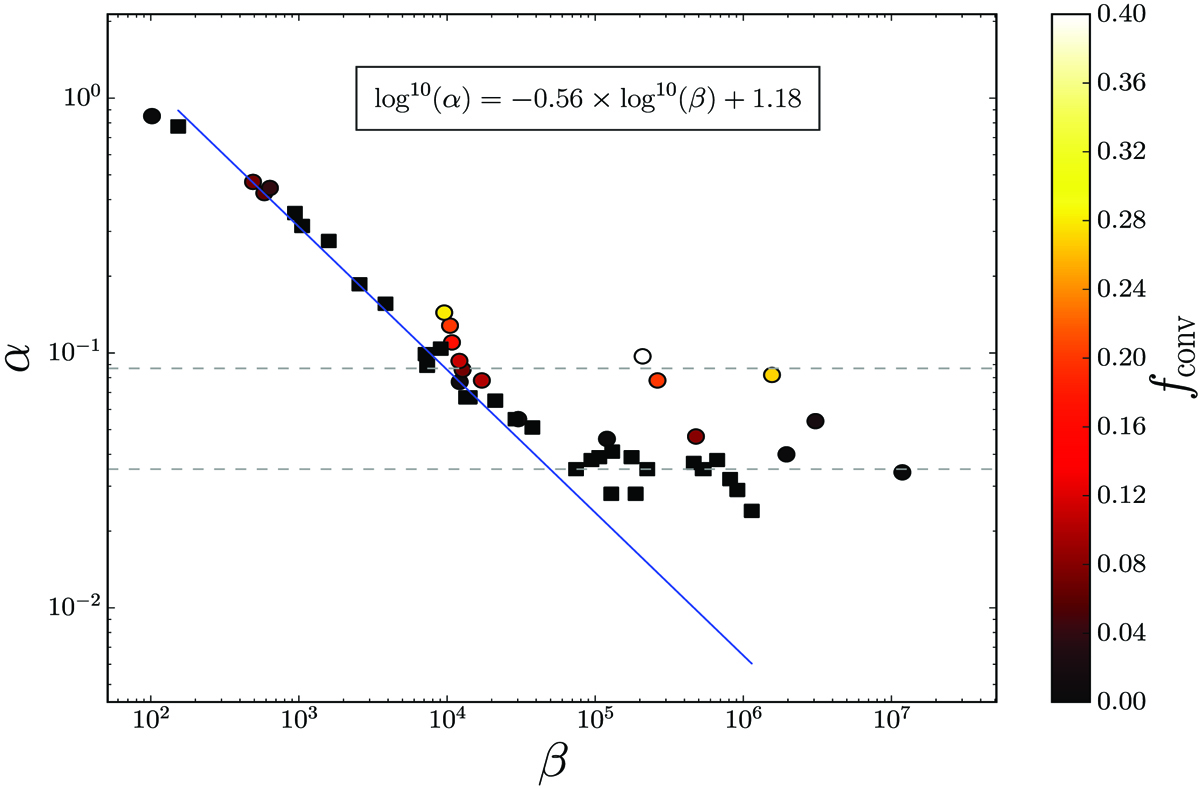
Square markers denote cold branch simulations, and circle markers denote hot branch simulations. The color indicates the value of fconv. Horizontal dotted gray lines show the value of α in ZNF simulations from S18 in a highly convective simulation of the hot branch (upper line) and a typical cold branch case (bottom line). The linear fit is made using data from the cold branch simulations with β ≲ 2 × 10⁴.
Current usage metrics show cumulative count of Article Views (full-text article views including HTML views, PDF and ePub downloads, according to the available data) and Abstracts Views on Vision4Press platform.
Data correspond to usage on the plateform after 2015. The current usage metrics is available 48-96 hours after online publication and is updated daily on week days.
Initial download of the metrics may take a while.