Free Access
Fig. 3
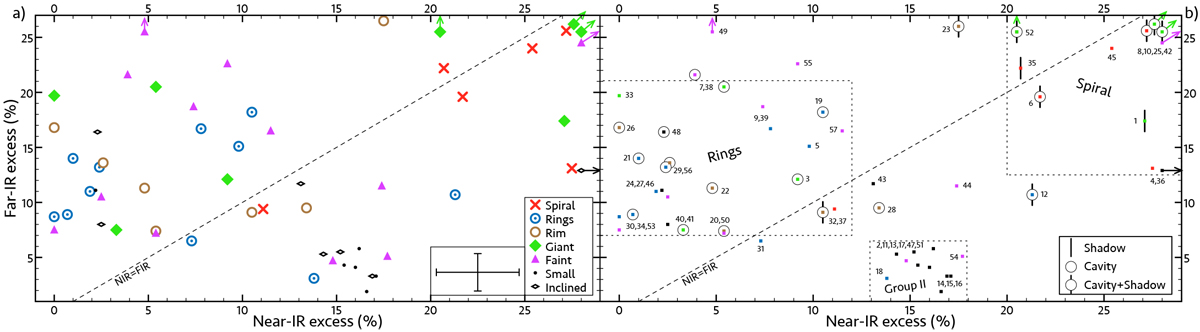
Near-/far-IR excess diagram. Panel a: average error bars are shown to the bottom right. The dashed line indicates the equality of the two quantities. Sources with an arrow sit outside of the box. Panel b: labeled version of panel a. The presence of cavities and shadows is indicated by circles and vertical bars.
Current usage metrics show cumulative count of Article Views (full-text article views including HTML views, PDF and ePub downloads, according to the available data) and Abstracts Views on Vision4Press platform.
Data correspond to usage on the plateform after 2015. The current usage metrics is available 48-96 hours after online publication and is updated daily on week days.
Initial download of the metrics may take a while.