Fig. 2
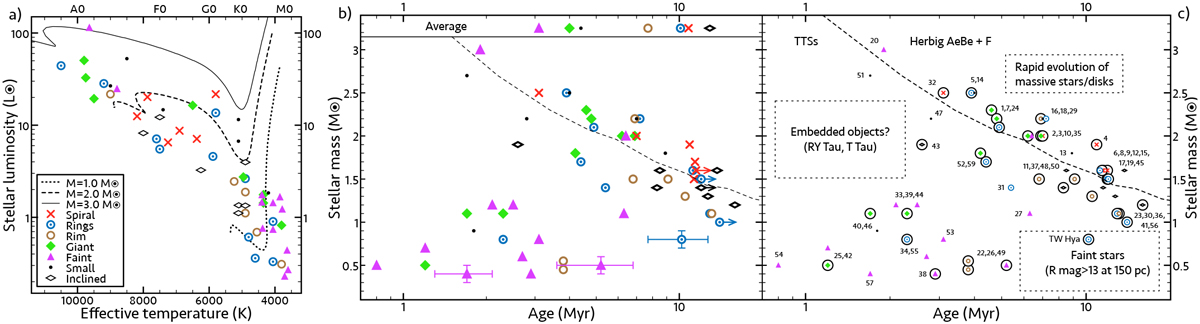
Stellar properties. Panel a: HR diagram. The three lines are the PMS tracks for the illustrative masses of 1, 2, and 3 M⊙ . Panel b: stellar mass vs. age diagram derived from the PMS tracks. The average of all categories is shown at the top. The dashed line divides Herbig AeBe + F stars from TTSs (G0-type). The three error bars shown are representative of the whole sample at different age intervals. Panel c: labeled version of the middle diagram. Circles indicate the presence of a cavity imaged with PDI and/or in the millimeter.
Current usage metrics show cumulative count of Article Views (full-text article views including HTML views, PDF and ePub downloads, according to the available data) and Abstracts Views on Vision4Press platform.
Data correspond to usage on the plateform after 2015. The current usage metrics is available 48-96 hours after online publication and is updated daily on week days.
Initial download of the metrics may take a while.