Fig. 5
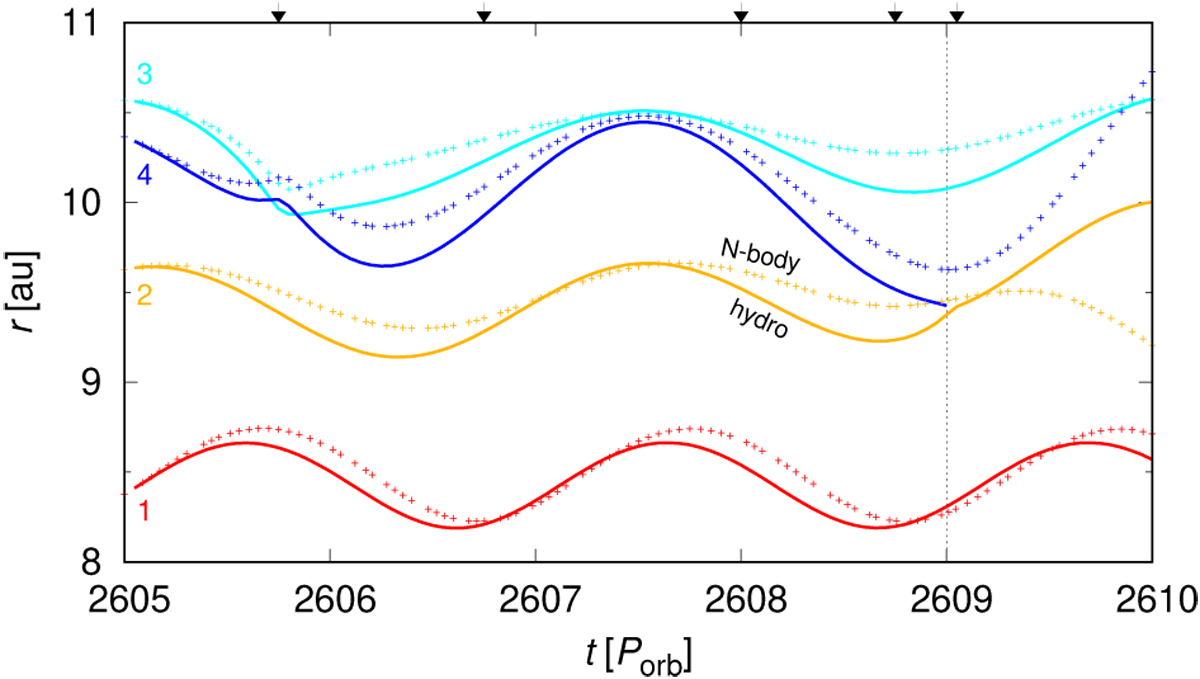
Heliocentric distance r versus time t for all four embryos in the simulation shown in Fig. 4. The black triangles correspond to the time of individual snapshots. There is an output from the full hydrodynamic simulation (lines), and an N-body simulation with no discs and no torques (points) for comparison. The latter was restarted from the very same initial conditions, at t = 2605 Porb. One can see the merger event at t ≐ 2609 Porb. In the case of the N-body simulation, the evolution is different, because without the disc torques the trajectories are mostly Keplerian, the encounter between embryos 3 and 4 just one orbit prior to the merger (2+4) has a different geometry, so the merger actually does not occur.
Current usage metrics show cumulative count of Article Views (full-text article views including HTML views, PDF and ePub downloads, according to the available data) and Abstracts Views on Vision4Press platform.
Data correspond to usage on the plateform after 2015. The current usage metrics is available 48-96 hours after online publication and is updated daily on week days.
Initial download of the metrics may take a while.