Fig. 3
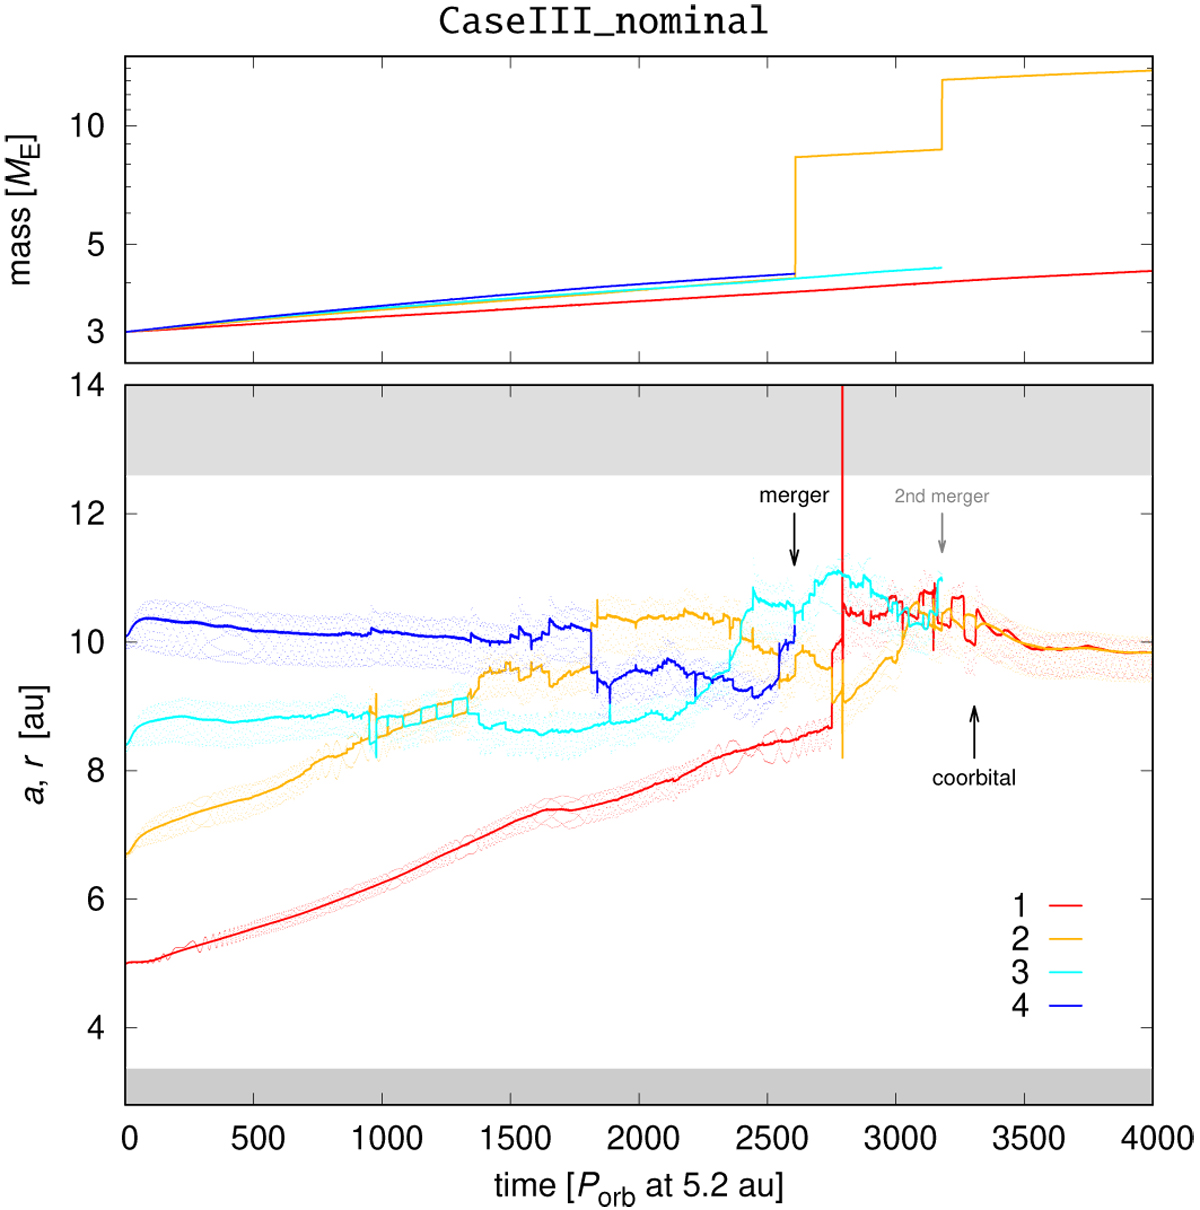
Semi-major axis a (line), the heliocentric distance r (dots) versus time t (bottom panel), and the embryo mass Mem versus t (top panel) for the nominal simulation with initially four embryos. The time span 4000 Porb correspondsto 47.4 kyr. Although it was already presented in Chrenko et al. (2017), we show it here to provide an easy (1:1) comparison. The grey strips indicate the inner and outer damping regions used to gradually suppress spurious reflections. The black arrows indicate two interesting events we study in detail: a merger (3+4), and a co-orbital formation. The semi-major axis may exhibit a “spike” during a close encounter, but in fact r ≪ a; the body is far from the damping zone.
Current usage metrics show cumulative count of Article Views (full-text article views including HTML views, PDF and ePub downloads, according to the available data) and Abstracts Views on Vision4Press platform.
Data correspond to usage on the plateform after 2015. The current usage metrics is available 48-96 hours after online publication and is updated daily on week days.
Initial download of the metrics may take a while.