Fig. 19
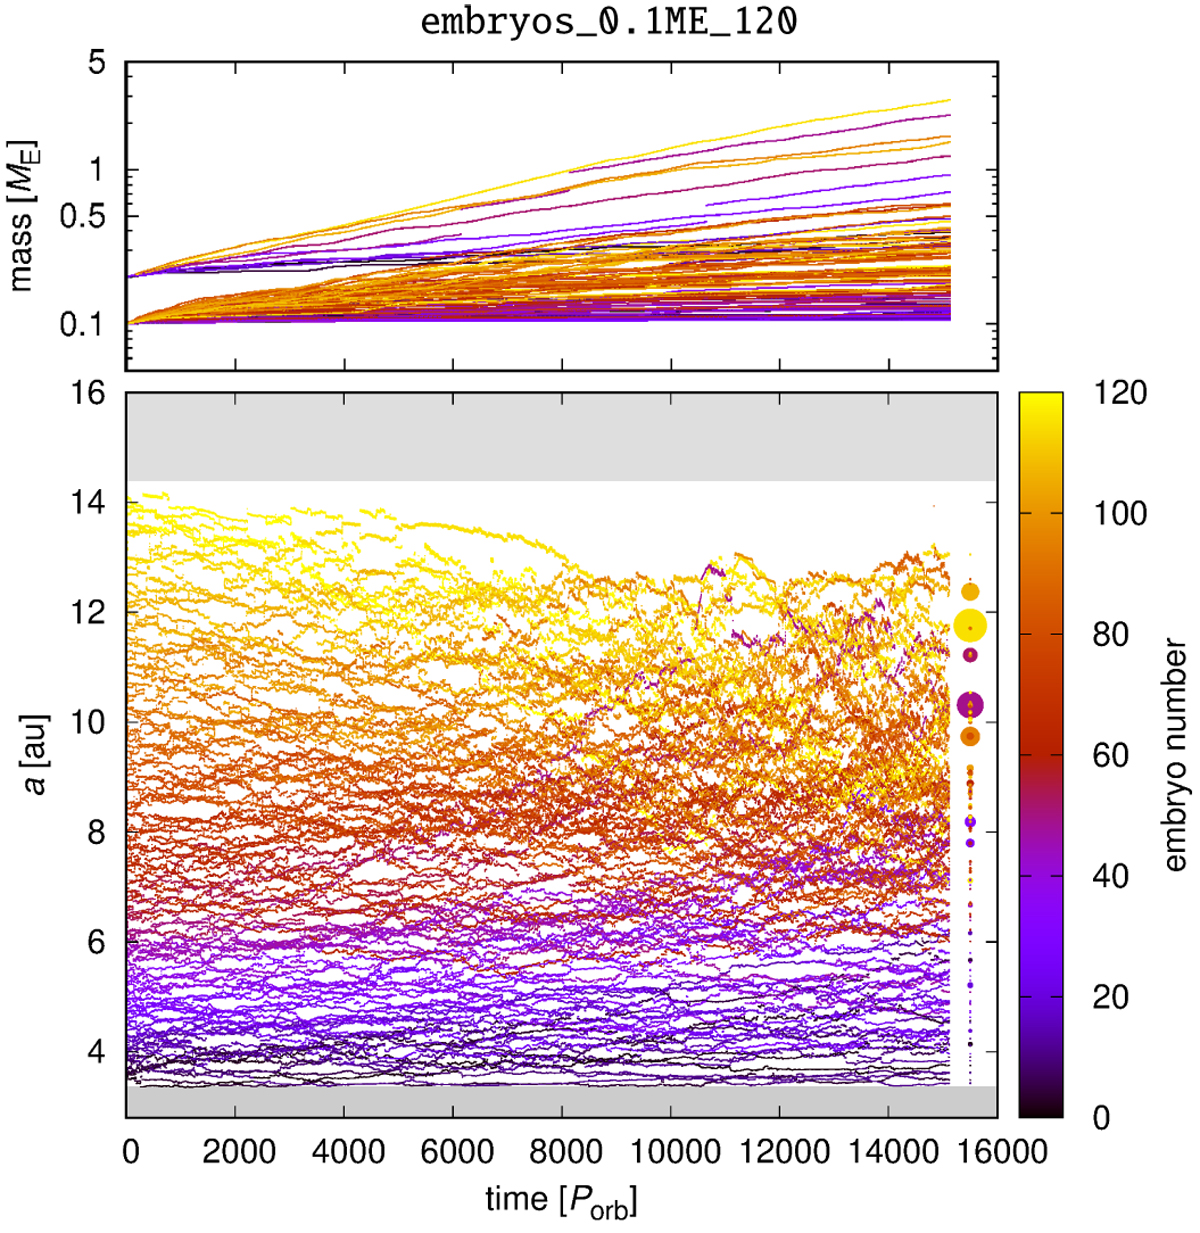
Semi-major axis a versus time t (bottom panel), and the embryo mass Mem versus t (top panel) for the simulation with 120 low-mass 0.1M⊕ embryos. Colours correspond to the embryo number to distinguish the individual orbits. The final state is depicted as a series of filled circles, with sizes proportional to the masses. The evolution is never regular but rather chaotic, partly due to direct N-body gravitational interactions among the embryos, but more importantly due to overlapping spiral arms(see also Fig. 18). Initially, there are only several mergers that create a handful of 0.2M⊕ embryos. These grow preferentially by the pebble accretion; there are a few additional mergers.
Current usage metrics show cumulative count of Article Views (full-text article views including HTML views, PDF and ePub downloads, according to the available data) and Abstracts Views on Vision4Press platform.
Data correspond to usage on the plateform after 2015. The current usage metrics is available 48-96 hours after online publication and is updated daily on week days.
Initial download of the metrics may take a while.