Fig. 18
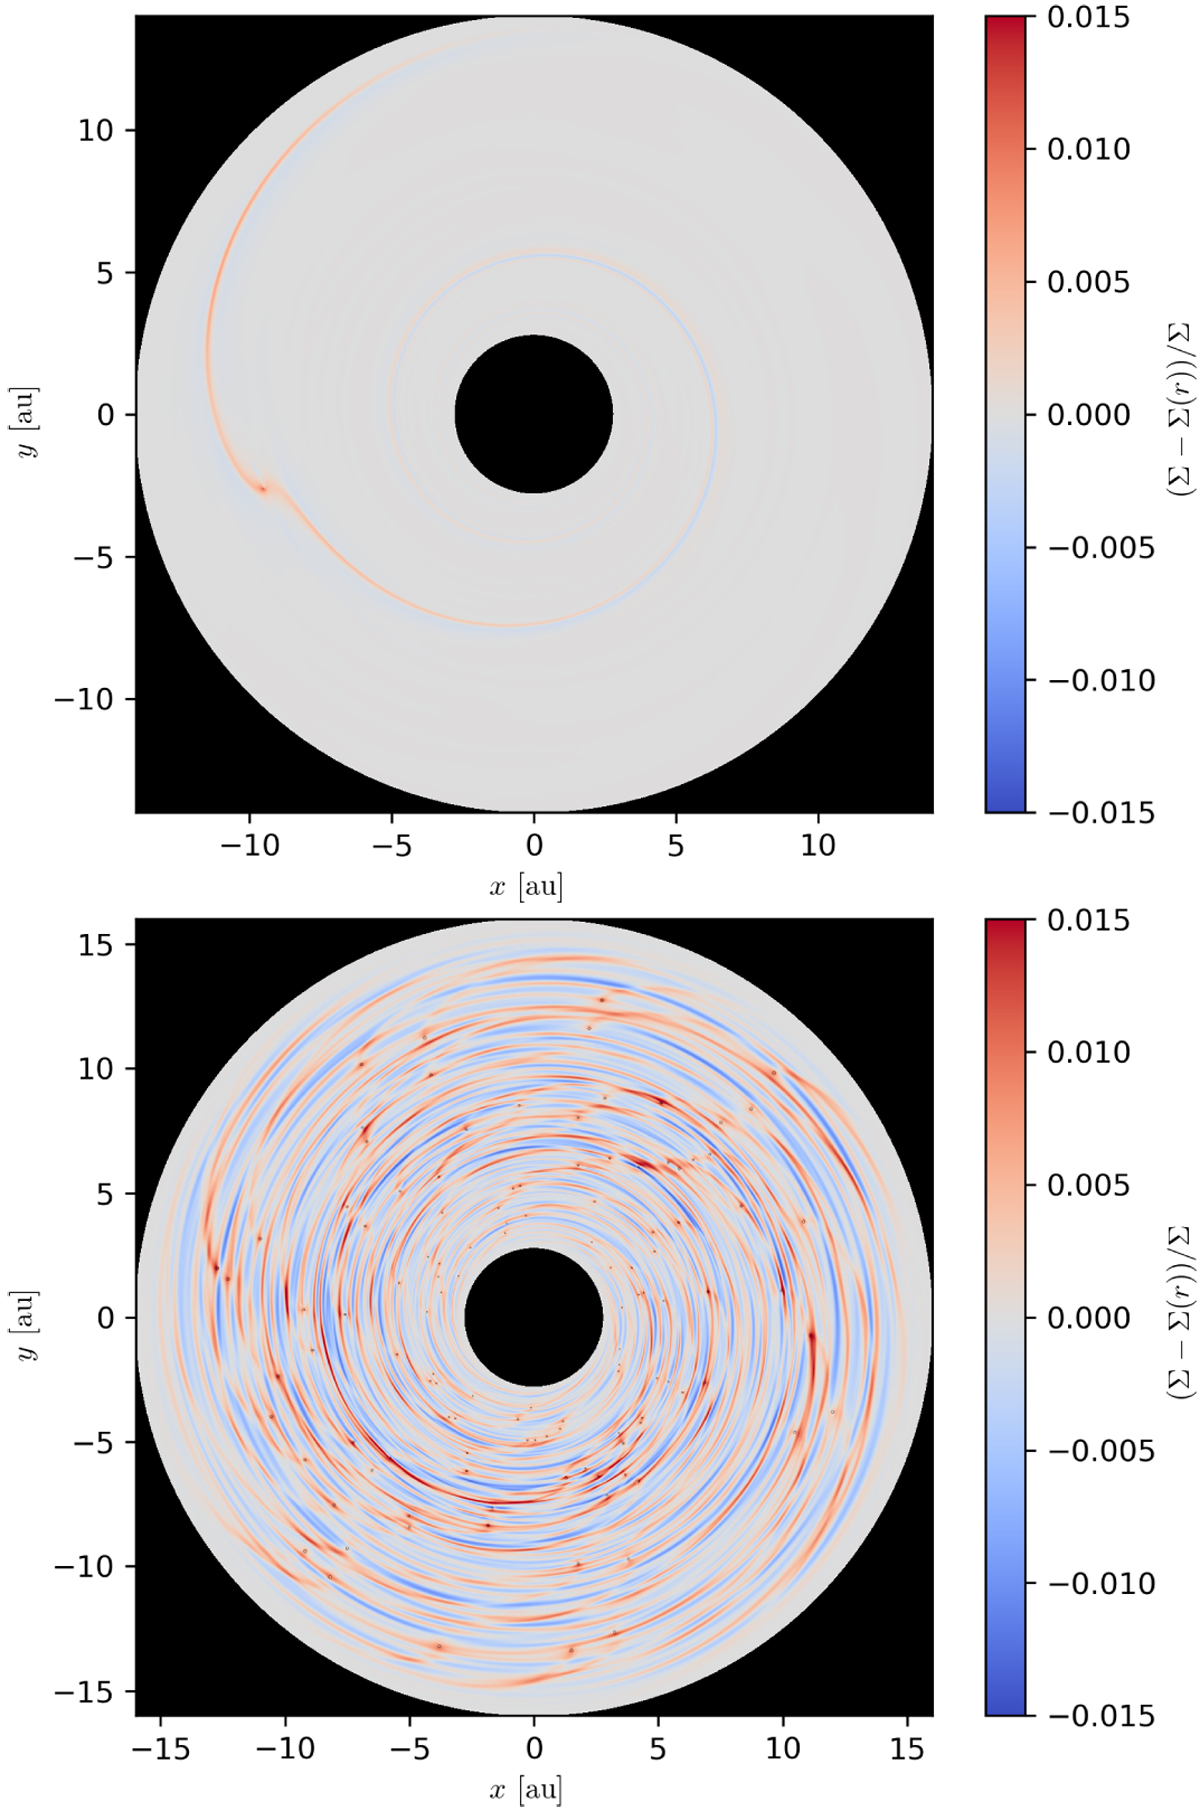
Surface density Σ(r, θ) of the gas disc with the azimuthally averaged profile Σ(r) subtractedto clearly see the respective spiral arms, the corotation region, and other perturbations in the surroundings of the Hill sphere. The system was evolved for 100 orbital periods Porb (at 5.2 au) so that the hot-trail effect can develop and increase the eccentricity. The situation is very different for a single 0.1 M⊕ embryo (top panel), with a very regular spiral, and for 120 embryos with the same masses (bottom panel), with spiral arms overlapping each other and creating an irregular overall pattern. The situation corresponds to Fig. 2, but it is much easier to see the perturbations when Σ − Σ (r) quantity is used. The resolution 3072 × 4096 was used for the former short-term simulation, and 2048 × 3072 for the latter. The Hill spheres are shown as small black circles.
Current usage metrics show cumulative count of Article Views (full-text article views including HTML views, PDF and ePub downloads, according to the available data) and Abstracts Views on Vision4Press platform.
Data correspond to usage on the plateform after 2015. The current usage metrics is available 48-96 hours after online publication and is updated daily on week days.
Initial download of the metrics may take a while.