Fig. 1
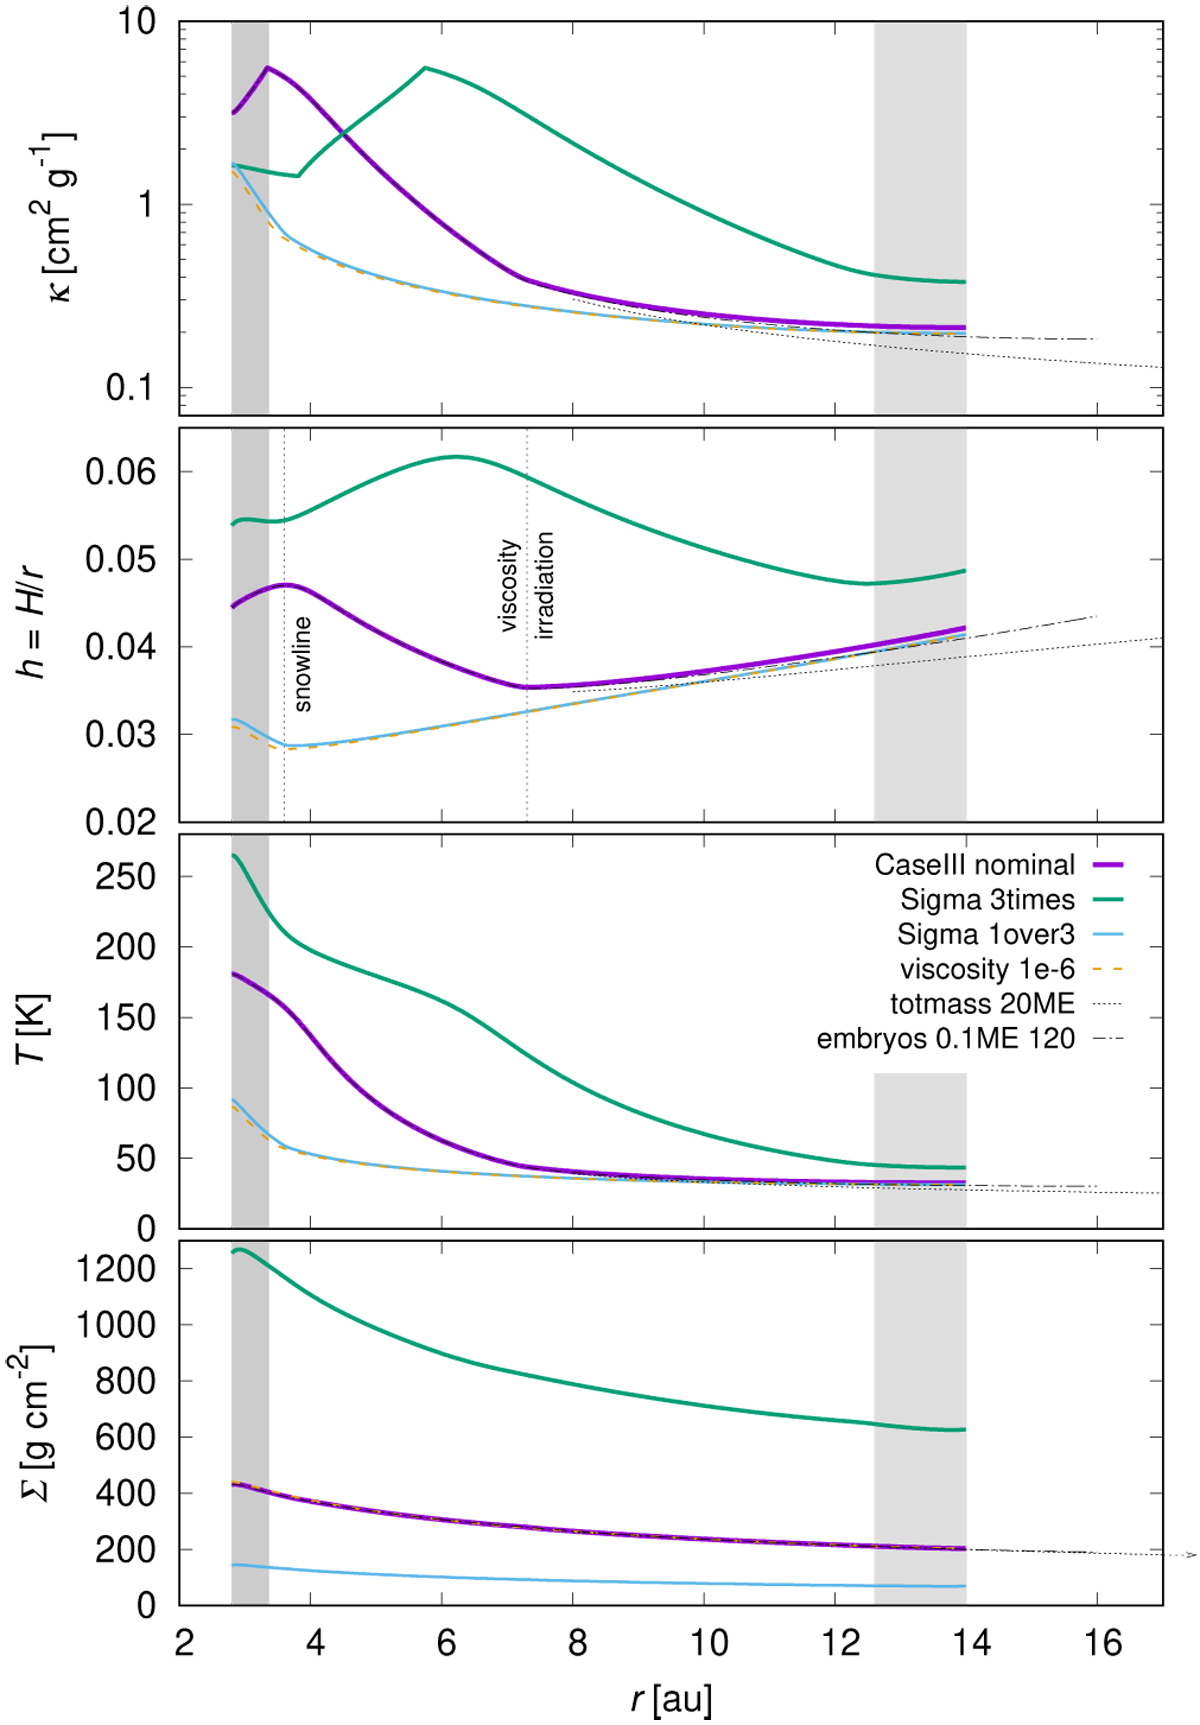
Profiles of the gas disc after the relaxation phase, which serve as the initial conditions for our simulations. From top to bottom panels: opacity κ, the aspect ratio h = H∕r, the temperature T, and the surface density Σ. The grey boxes indicate the extent of the damping zones at the inner and outer BC. The vertical dotted lines show the snowline, and the transition between the viscous heating and the stellar irradiation regions, in the case of the nominal simulation. Some of the simulations actually use the same disc as the nominal one. For totmass_20ME simulation we had to use an outer disc, spanning from 8 to 40 au. Similarly, we used a slightly larger disc (up to 16 au) for the simulation embryos_0.1ME_120.
Current usage metrics show cumulative count of Article Views (full-text article views including HTML views, PDF and ePub downloads, according to the available data) and Abstracts Views on Vision4Press platform.
Data correspond to usage on the plateform after 2015. The current usage metrics is available 48-96 hours after online publication and is updated daily on week days.
Initial download of the metrics may take a while.