Fig. A.6.
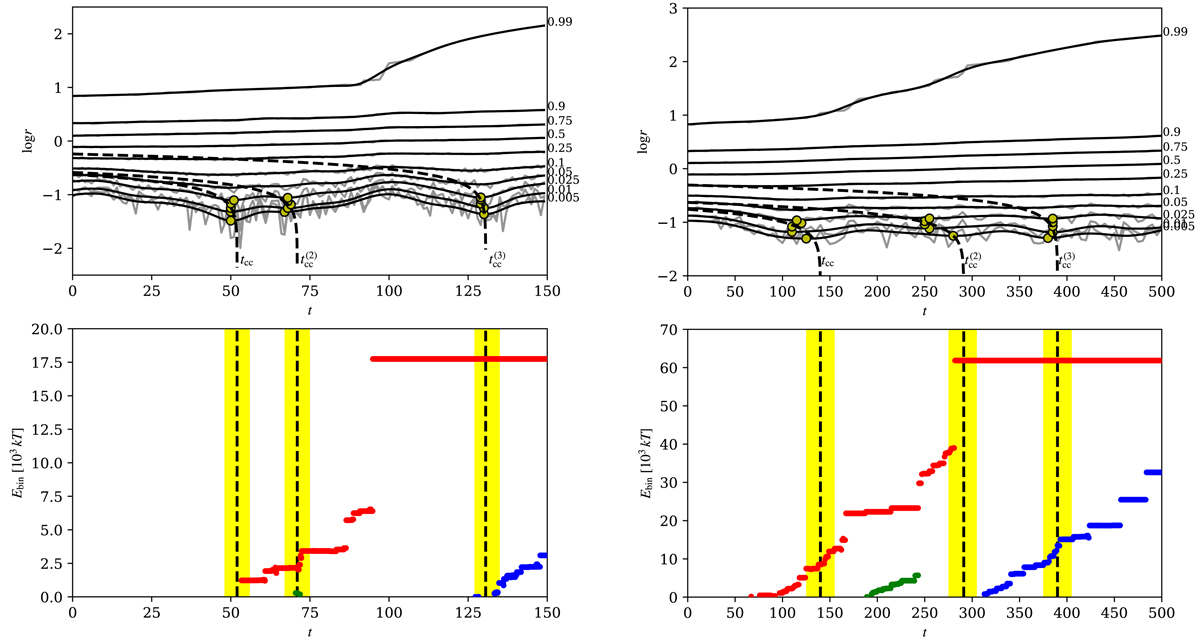
Sequences of minima and binary star binding energy evolution in one realisation of model m-20k(left) and of model m-100k(right). Top: Lagrangian radii. Circles correspond to the minima of the radii, and the dashed lines are the power-law fits (11). Bottom: evolution of the binding energies of the dynamically formed binary stars. Each colour corresponds to one binary star family line, in which the individual components may be exchanged due to interactions with other stars. Black dashed vertical lines indicate the times of the homologous collapses, highlighted areas around them are the time intervals used for the evaluation of ΔEbin.
Current usage metrics show cumulative count of Article Views (full-text article views including HTML views, PDF and ePub downloads, according to the available data) and Abstracts Views on Vision4Press platform.
Data correspond to usage on the plateform after 2015. The current usage metrics is available 48-96 hours after online publication and is updated daily on week days.
Initial download of the metrics may take a while.