Fig. A.5.
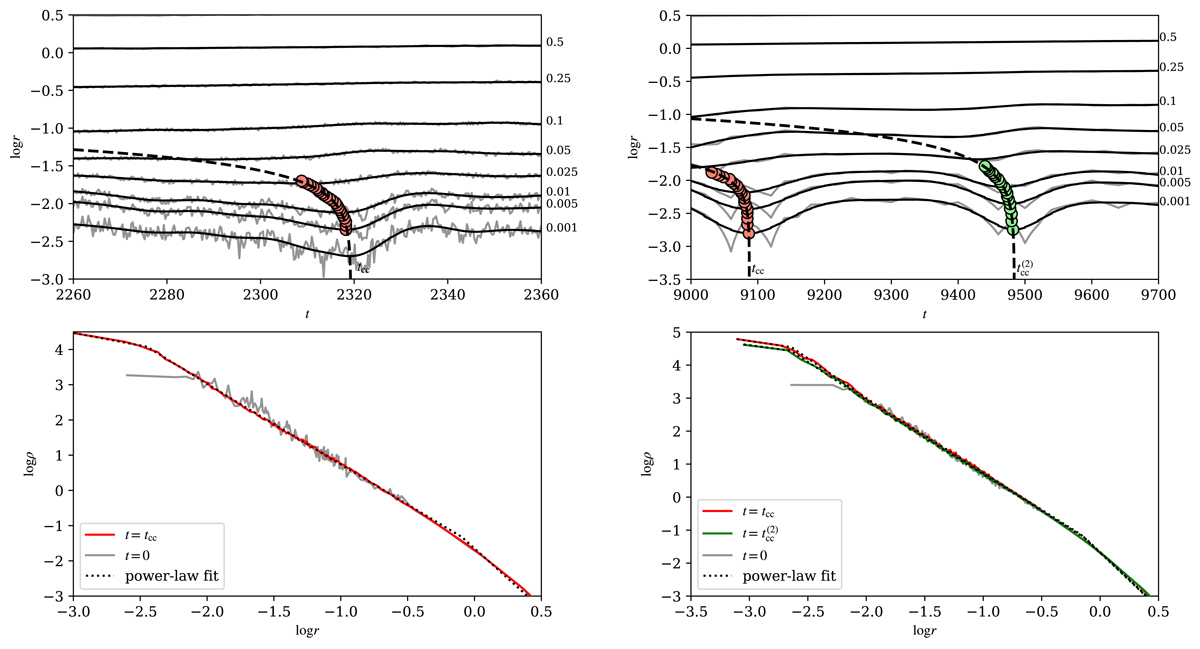
Top: detail of the inner Lagrangian radii of one realisation of model e-10k (left) and of model e-50k (right). Circles correspond to the minima of smoothed radii, that is, set (8), and the dashed line is a power-law fit (11) through these data. Bottom: radial density profiles of this realisation at the given times in the range of radii plotted above. The dotted line demonstrates a fit by the triple-broken power-law function (15). The grey line shows an initial state of the system for comparison.
Current usage metrics show cumulative count of Article Views (full-text article views including HTML views, PDF and ePub downloads, according to the available data) and Abstracts Views on Vision4Press platform.
Data correspond to usage on the plateform after 2015. The current usage metrics is available 48-96 hours after online publication and is updated daily on week days.
Initial download of the metrics may take a while.