Fig. 1.
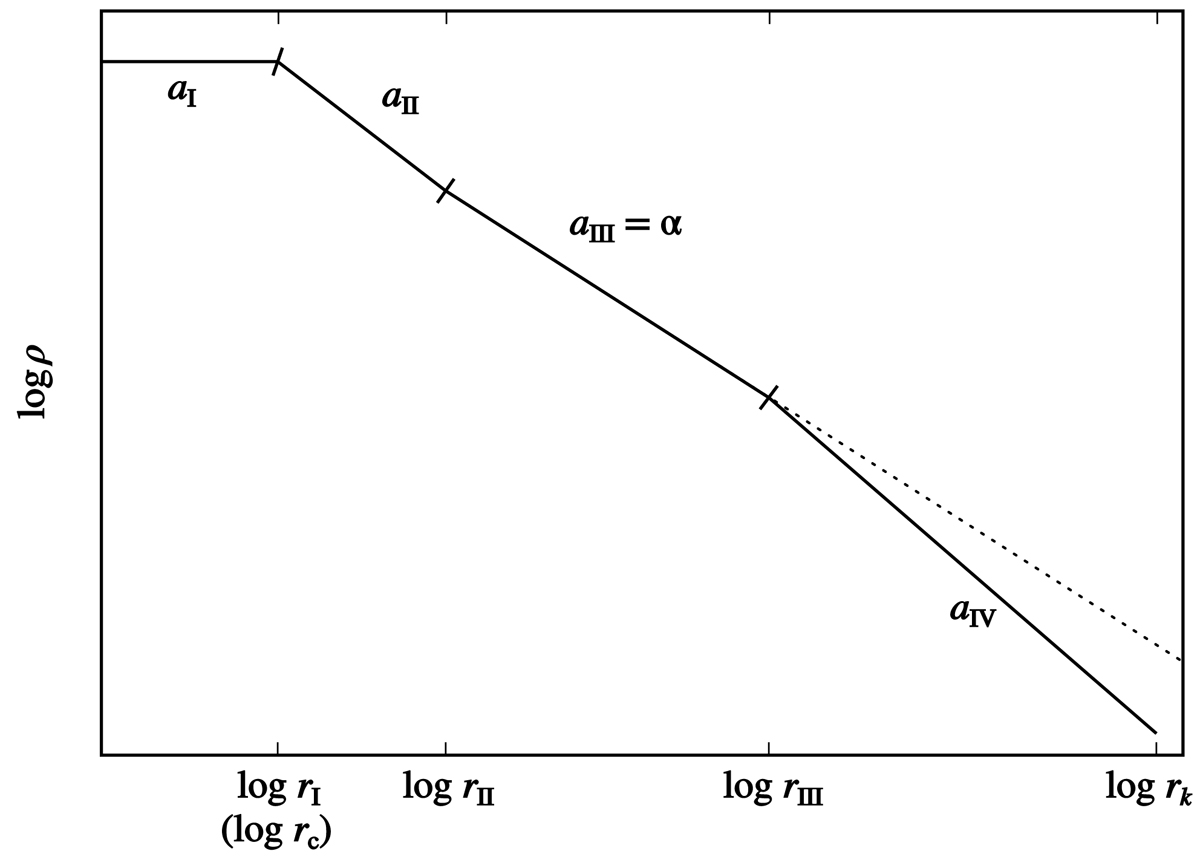
Schematic plot of the radial density profile in an N-body cluster during the core collapse with four different values of the logarithmic density gradient, aI − IV. The dotted line has a slope equal to α and shows the asymptotic solution of Lynden-Bell & Eggleton (1980). The break radius rI is identified with the core radius, rIII roughly corresponds to the half-mass radius, and rk is the cluster radius. The notation is the same as in Eq. (15) that we used for the fitting of our numerical models.
Current usage metrics show cumulative count of Article Views (full-text article views including HTML views, PDF and ePub downloads, according to the available data) and Abstracts Views on Vision4Press platform.
Data correspond to usage on the plateform after 2015. The current usage metrics is available 48-96 hours after online publication and is updated daily on week days.
Initial download of the metrics may take a while.