Free Access
Fig. B.1.
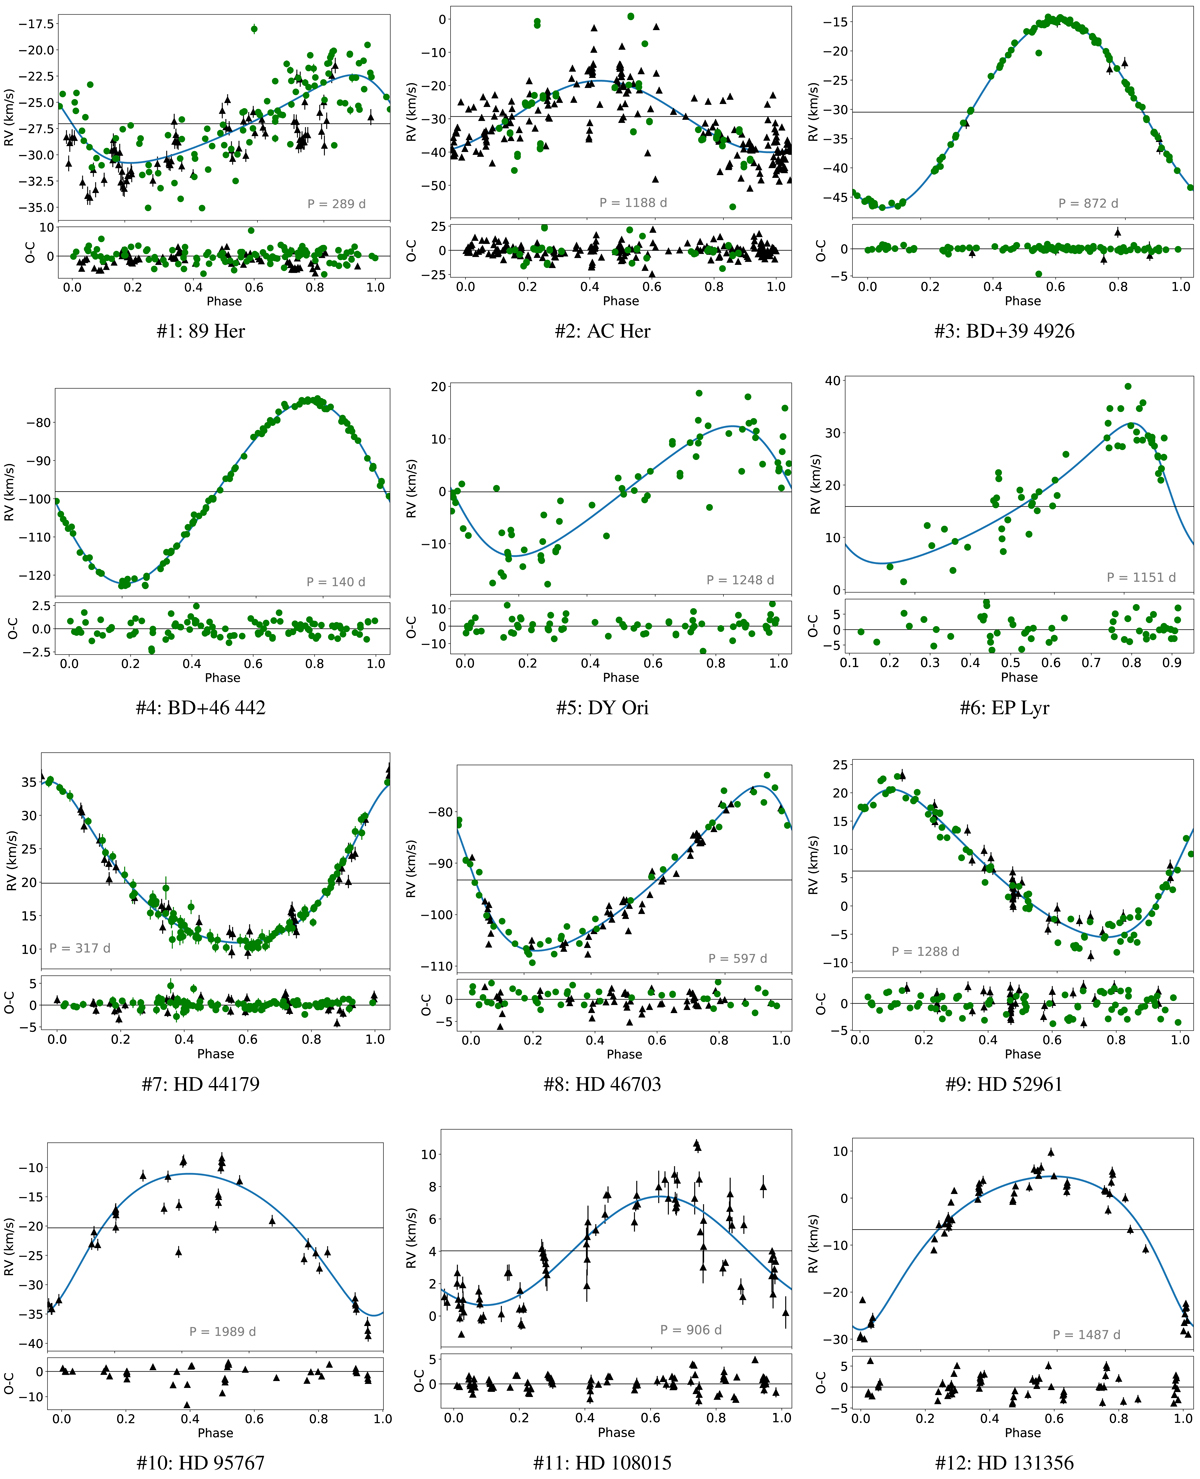
Phase-folded orbits of post-AGB binaries in our sample. Green circles show data points taken with the HERMES spectrograph, while black triangles are older data. The systemic velocity is given by the horizontal black line. The residuals are shown below each radial-velocity curve.
Current usage metrics show cumulative count of Article Views (full-text article views including HTML views, PDF and ePub downloads, according to the available data) and Abstracts Views on Vision4Press platform.
Data correspond to usage on the plateform after 2015. The current usage metrics is available 48-96 hours after online publication and is updated daily on week days.
Initial download of the metrics may take a while.