Fig. 7.
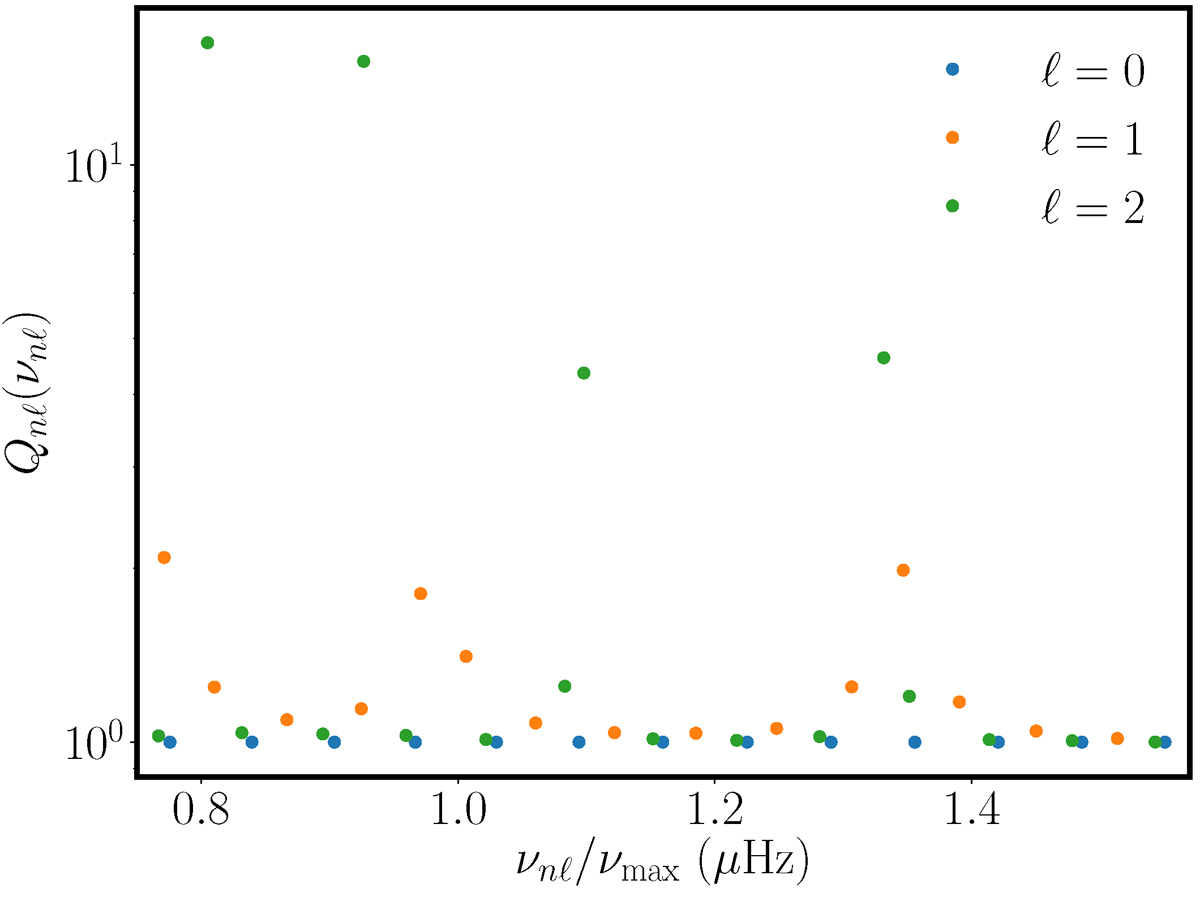
Ratio Qnℓ of a mode of degree nℓ against frequency of the same mode normalized by νmax (only νnℓ/νmax > 0.75 for clarity), for the sub-giant model Cm10 with Teff = 6503 K, log g = 4.0 and [Fe/H] = − 1.0. Each colour corresponds to a degree ℓ. Yellow (resp. green) dots breaking from the general trend correspond to dipolar (resp. quadrupolar) mixed modes.
Current usage metrics show cumulative count of Article Views (full-text article views including HTML views, PDF and ePub downloads, according to the available data) and Abstracts Views on Vision4Press platform.
Data correspond to usage on the plateform after 2015. The current usage metrics is available 48-96 hours after online publication and is updated daily on week days.
Initial download of the metrics may take a while.