Fig. 4.
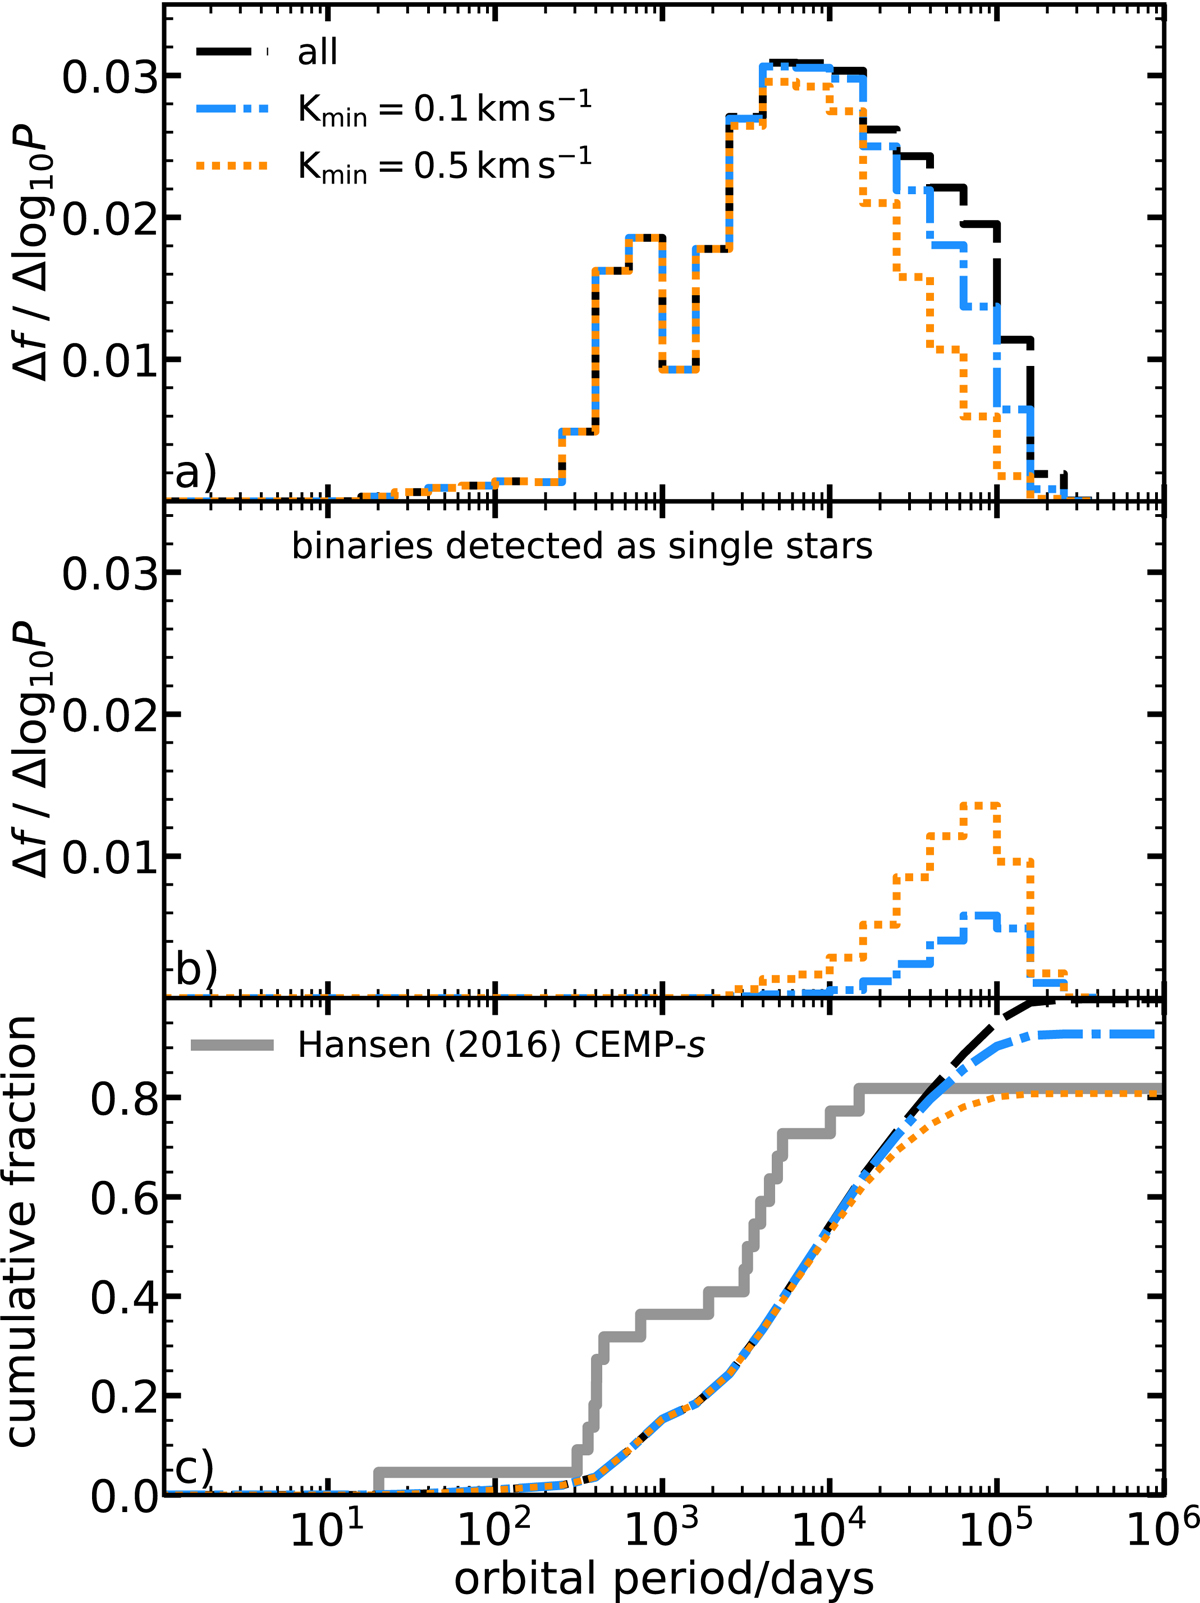
Panel a: period distributions of synthetic CEMP-s stars computed with our model set M2 and with different adopted detection thresholds for radial-velocity variations. The dashed black line shows the period distribution of all the CEMP-s stars in our simulation. The dot-dashed blue and dotted orange lines show the period distributions of the simulated CEMP-s stars with detection thresholds of Kmin = 0.1 and 0.5 km s−1, respectively. Panel b: same as in panel a for synthetic CEMP-s stars that would be detected as singles with the above thresholds. Panel c: the cumulative orbital-period distributions corresponding to the models in panel a are compared with the observed distribution calculated with the data of Hansen et al. (2016, solid grey line).
Current usage metrics show cumulative count of Article Views (full-text article views including HTML views, PDF and ePub downloads, according to the available data) and Abstracts Views on Vision4Press platform.
Data correspond to usage on the plateform after 2015. The current usage metrics is available 48-96 hours after online publication and is updated daily on week days.
Initial download of the metrics may take a while.