Fig. 3.
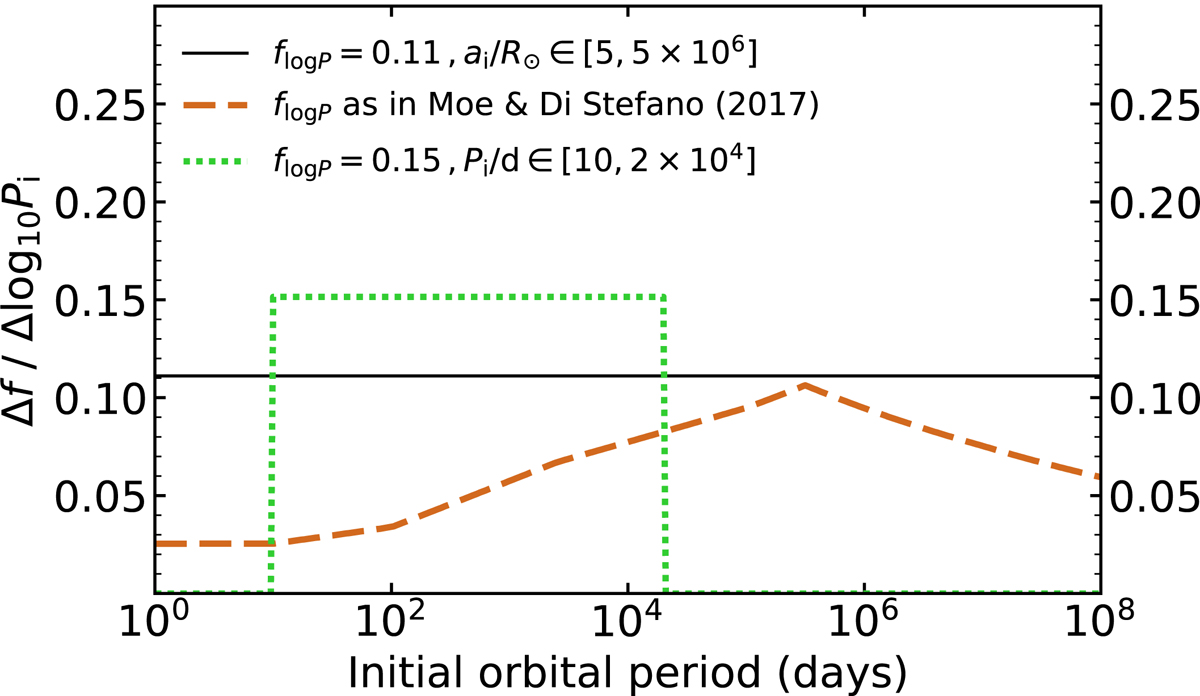
Initial period distributions adopted in our models. The vertical axis represents the binary fraction in each period bin, i.e. flog P. The solid black line represents our default initial distribution of separations, which is flat in log10 ai between 5 R⊙ and 5 × 10⁶ R⊙, with flog P = 0.11 over this interval. The dashed brown line shows the prescription of Moe & Di Stefano (2017), adopted in set M13, for a 1.0 M⊙ primary and mass ratio M2,i/M1,i > 0.1. The shape and maximum of the distribution of Moe & Di Stefano (2017) depend on the primary mass and mass ratio. The dotted green line shows a period distribution flat in log10 Pi and with flog P = 0.15 in the period range [10, 2 × 10⁴] days, which we adopt in our model set M14. The integral of each curve represents the total binary fraction over the period interval.
Current usage metrics show cumulative count of Article Views (full-text article views including HTML views, PDF and ePub downloads, according to the available data) and Abstracts Views on Vision4Press platform.
Data correspond to usage on the plateform after 2015. The current usage metrics is available 48-96 hours after online publication and is updated daily on week days.
Initial download of the metrics may take a while.