Free Access
Fig. B.1.
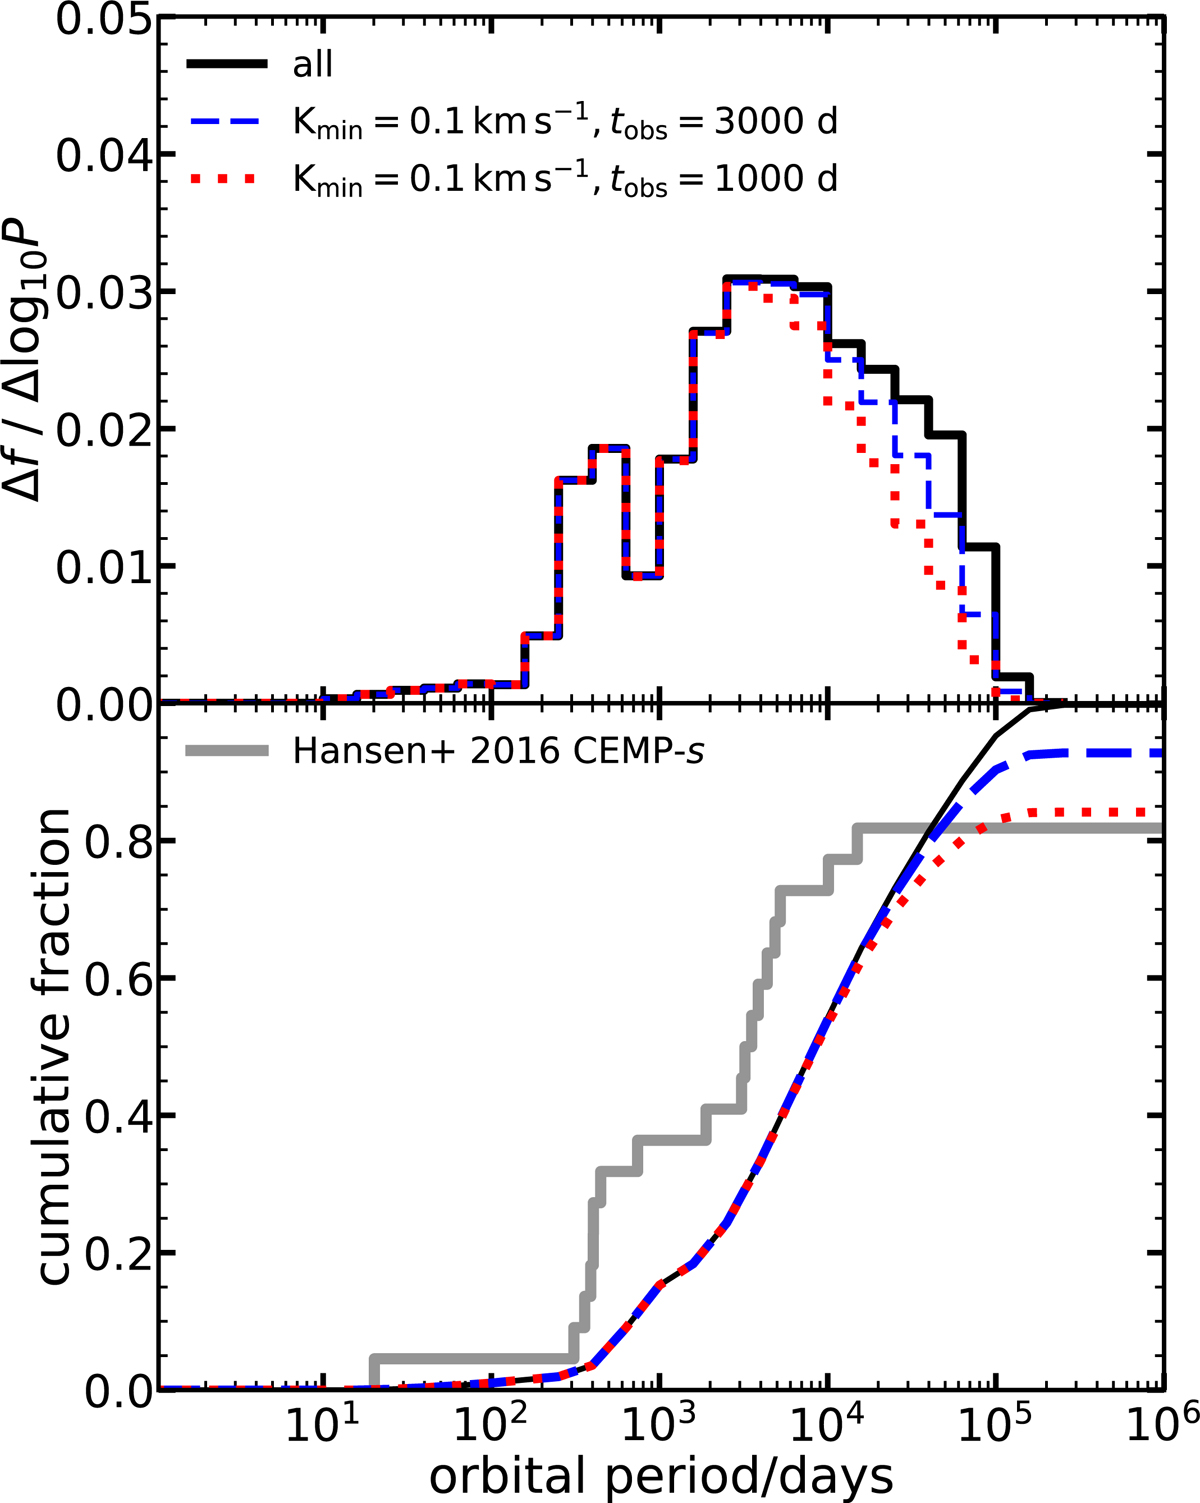
As Fig. 5 for models with different time-span of the radial-velocity monitoring. The solid black line shows the period distribution of all the CEMP-s stars in our simulation. The dashed blue and dotted red lines are computed with a detection threshold Kmin = 0.1 km s−1 and a time-span of 3000 and 1000 days, respectively.
Current usage metrics show cumulative count of Article Views (full-text article views including HTML views, PDF and ePub downloads, according to the available data) and Abstracts Views on Vision4Press platform.
Data correspond to usage on the plateform after 2015. The current usage metrics is available 48-96 hours after online publication and is updated daily on week days.
Initial download of the metrics may take a while.